Introduction
In this tutorial, you will learn how to install ELK STack using Docker Compose on a server running Ubuntu (version 22.04). ELK Stack consists of Elasticsearch, Kibana, and Logstash.
- Elasticsearch is a search and analytics engine.
- Kibana is a user interface for data analysis.
- Logstash can analyze application-related logs.
Prerequisites
- A server running Ubuntu 22.04 or later: SSH access to that server and root or sudo user access
- Basic knowledge of Docker, Docker Compose, ElasticSearch, and YAML
Step 1 – Install Docker Compose
If you already have Docker Compose installed on your server, you can skip this step. First, SSH into your server using the following command:
ssh holu@<your_host>
Make sure to update the apt packages and install cURL:
sudo apt-get update && sudo apt-get install curl -y
After ensuring that curl is installed, we can use the quick install script provided by Docker to install Docker as well as Docker Compose:
curl https://get.docker.com | sh
This command downloads the script from get.docker.com and “pipes” it into sh (feeds the downloaded script to sh, which runs it and installs Docker). The last thing we can do is add ourselves to the Docker group so we don’t have to use sudo every time we use the docker command.
sudo usermod -aG docker holu
Be sure to log out and log back in to apply the changes.
Step 2 – Create docker-compose.yaml
File docker-compose.yaml It will be used to declare all the infrastructure of the ELK stack. It is used to create multiple containers with a single command.
Create a new folder on your server and create a file docker-compose.yaml Create in it:
mkdir elk-stack && cd elk-stack && touch docker-compose.yaml
We want to use Docker Compose to create three Docker containers:
To create these three containers, add the following content to the file docker-compose.yaml Add:
version: "3"
services:
setup:
image: docker.elastic.co/elasticsearch/elasticsearch:8.12.1
environment:
- ELASTIC_PASSWORD=${ELASTIC_PASSWORD}
- KIBANA_PASSWORD=${KIBANA_PASSWORD}
container_name: setup
command:
- bash
- -c
- |
echo "Waiting for Elasticsearch availability";
until curl -s http://elasticsearch:9200 | grep -q "missing authentication credentials"; do sleep 30; done;
echo "Setting kibana_system password";
until curl -s -X POST -u "elastic:${ELASTIC_PASSWORD}" -H "Content-Type: application/json" http://elasticsearch:9200/_security/user/kibana_system/_password -d "{\"password\":\"${KIBANA_PASSWORD}\"}" | grep -q "^{}"; do sleep 10; done;
echo "All done!";
elasticsearch:
image: docker.elastic.co/elasticsearch/elasticsearch:8.12.1
# give the container a name
# this will also set the container's hostname as elasticsearch
container_name: elasticsearch
environment:
- discovery.type=single-node
- cluster.name=elasticsearch
- bootstrap.memory_lock=true
# limits elasticsearch to 1 GB of RAM
- ES_JAVA_OPTS=-Xms1g -Xmx1g
# The password for the 'elastic' user
- ELASTIC_PASSWORD=${ELASTIC_PASSWORD}
- xpack.security.http.ssl.enabled=false
kibana:
image: docker.elastic.co/kibana/kibana:8.12.1
container_name: kibana
ports:
- 5601:5601
environment:
# remember the container_name for elasticsearch?
# we use it here to access that container
- ELASTICSEARCH_HOSTS=http://elasticsearch:9200
- ELASTICSEARCH_USERNAME=kibana_system
- ELASTICSEARCH_PASSWORD=${KIBANA_PASSWORD}
# Change this to true if you want to sent
# telemetry data to kibana developers
- TELEMETRY_ENABLED=false
We are currently missing one element, the .env file. The .env file is used to store secrets like passwords and API tokens to remove them from your configuration or code. Docker Compose automatically detects the .env file and replaces variables like ${MY_VARIABLE} with the env variable.
Create env and add the following lines:
ELASTIC_PASSWORD=<your-elastic-password>
KIBANA_PASSWORD=<your-kibana-password>
Now you can run docker compose to get everything up and running:
docker compose up -d
Output:
[+] Running 3/4
⠇ Network elk-stack_default Created
:heavy_check_mark: Container kibana Started
:heavy_check_mark: Container setup Started
:heavy_check_mark: Container elasticsearch Started
You can use the command docker ps Use to check if everything is working as expected.
holu@<your_host>:~/elk-stack$ docker ps
CONTAINER ID IMAGE COMMAND CREATED STATUS PORTS NAMES
<id> docker.elastic.co/kibana/kibana:8.12.1 "<command>" About a minute ago Up About a minute 0.0.0.0:5601->5601/tcp, :::5601->5601/tcp kibana
<id> docker.elastic.co/elasticsearch/elasticsearch:8.12.1 "<command>" About a minute ago Up About a minute 9200/tcp, 9300/tcp elasticsearch
You can now launch Kibana in a web browser by entering :5601 Open in the URL bar.
With username elastic and the password previously saved in the file .env You have decided to log in.
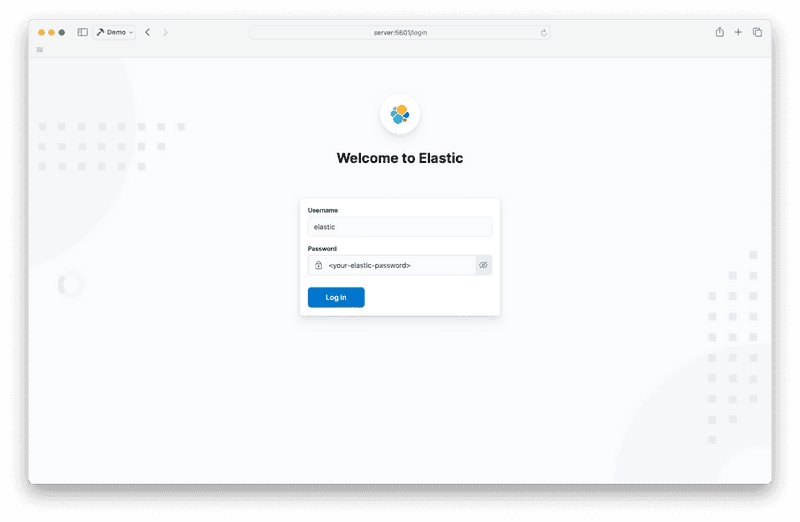
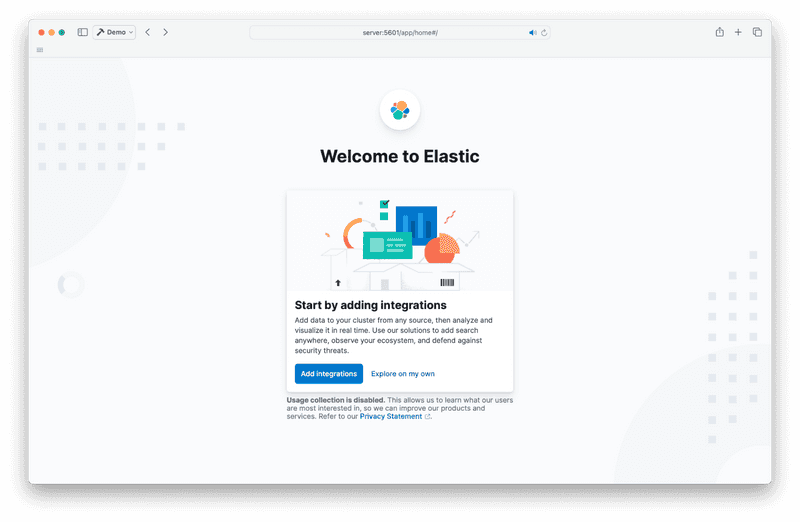
If you see this page when you log in, click “Explore On My Own.”.
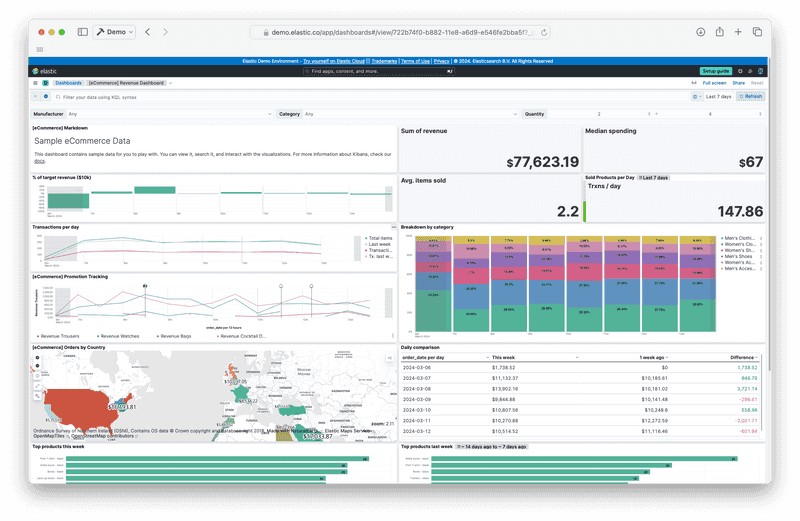
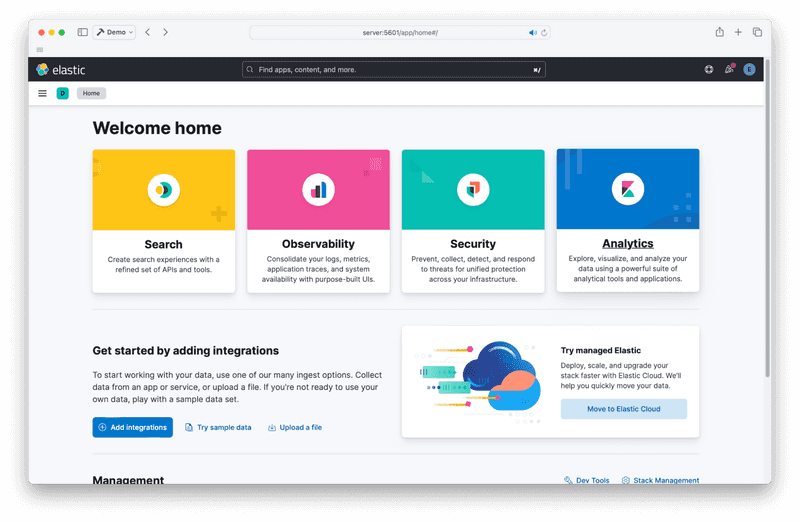
You should now be able to access the Kibana home page. It looks like this:

Step 3 – Logstash
Now it's time to add the final piece of the puzzle, Logstash. Logstash can analyze logs from your application(s) and deliver the analyzed logs to elasticsearch.
docker-compose.yaml Edit and add the fourth container in the “Services” section under “kibana”.
logstash:
image: docker.elastic.co/logstash/logstash:8.12.1
container_name: logstash
command:
- /bin/bash
- -c
- |
cp /usr/share/logstash/pipeline/logstash.yml /usr/share/logstash/config/logstash.yml
echo "Waiting for Elasticsearch availability";
until curl -s http://elasticsearch:9200 | grep -q "missing authentication credentials"; do sleep 1; done;
echo "Starting logstash";
/usr/share/logstash/bin/logstash -f /usr/share/logstash/pipeline/logstash.conf
environment:
- xpack.monitoring.enabled=false
- ELASTIC_USER=elastic
- ELASTIC_PASSWORD=${ELASTIC_PASSWORD}
- ELASTIC_HOSTS=http://elasticsearch:9200
volumes:
- ./logstash.conf:/usr/share/logstash/pipeline/logstash.conf
Setting up Logstash is a little more complicated. You need an additional configuration file called logstash.conf. Logstash works on something called a pipeline. This is a file that describes what Logstash should do (where the logs come from, how to parse the logs, where to send them). The pipeline will be in the logstash.conf file.
This is one of the most basic lines of things you can have:
input {
file {
path => "/var/log/dpkg.log"
start_position => "beginning"
}
}
filter { }
output {
elasticsearch {
hosts => "${ELASTIC_HOSTS}"
user => "elastic"
password => "${ELASTIC_PASSWORD}"
index => "logstash-%{+YYYY.MM.dd}"
}
stdout { }
}
It is quite self-explanatory. It takes a file as input (in this case /var/log/dpkg.log) and outputs to Elasticsearch and stdout.
Place the above example in your logstash.conf file.
The elk-stack directory should now contain the following files:
elk-stack/
├── .env
├── docker-compose.yaml
└── logstash.conf
You can now start Logstash using the following command:
docker compose up -d
Output:
[+] Running 4/4
:heavy_check_mark: Container logstash Started
:heavy_check_mark: Container setup Started
:heavy_check_mark: Container elasticsearch Running
:heavy_check_mark: Container kibana Running
Now you can access Logstash from Kibana. First you need to create a logstash data view.
Go to the Analytics discovery page. You should see something like this:
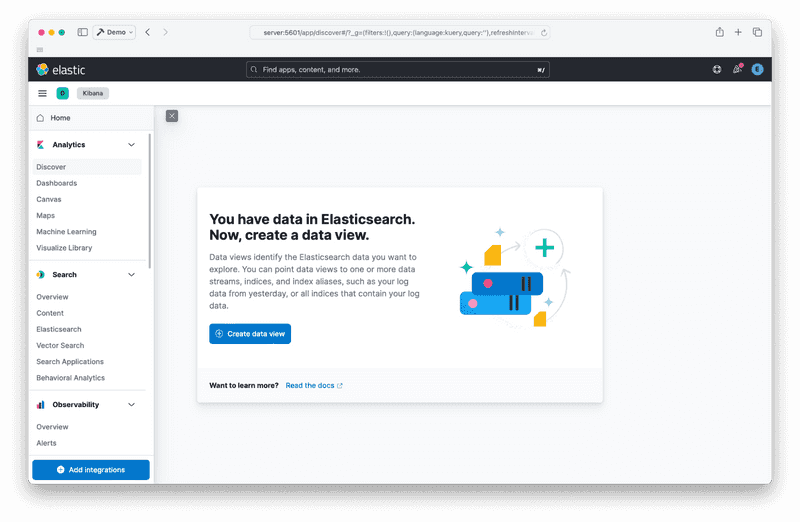
Create your data view by clicking the “Create Data View” button:
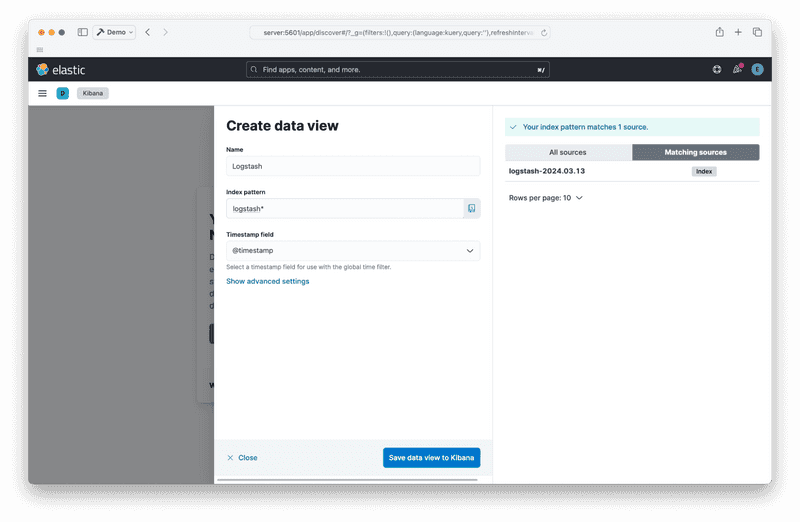
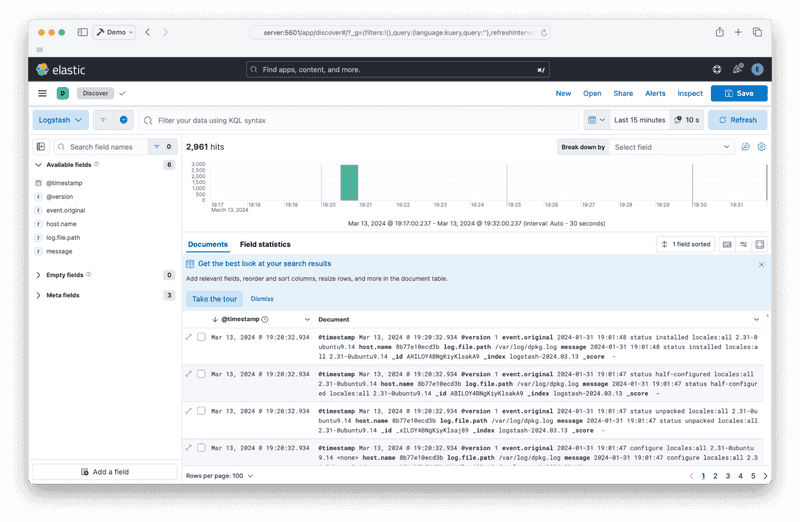
After saving the data view, you should be able to see the reports coming from Logstash:
Step 4 – Destroy the stack
Finally, to stop the stack and remove the containers, run the following command:
docker compose down
Output:
[+] Running 5/5
:heavy_check_mark: Container logstash Removed
:heavy_check_mark: Container elasticsearch Removed
:heavy_check_mark: Container kibana Removed
:heavy_check_mark: Container setup Removed
:heavy_check_mark: Network elk-stack_default Removed
Result
You should have an ELK stack running with Docker Compose. The next steps are to add report generators like Filebeat or check the official documentation.