
Introduction
A flowchart is the best way to visualize a complex process for your team. There are over 30 standard symbols you can use to create a flowchart. These symbols can represent anything from a process to a document to decisions that need to be made. In this article, you'll learn what the different shapes mean, when a flowchart can be useful, and what types of flowcharts you can implement in the workplace.
Whether you're a business owner looking to streamline operations, a project manager looking to keep your team on track, or a software developer designing a new app, flowcharts can be an invaluable tool. By breaking down complex processes into clear, logical steps, flowcharts help you identify potential bottlenecks, optimize workflows, and communicate ideas effectively. In this comprehensive guide, we'll explore the basics of flowcharts, including their symbols, types, and practical uses.
What is a flowchart?
A flowchart is a diagram that shows the steps, sequences, and decisions of a process or workflow. While there are many different types of flowcharts, the basic flowchart is the simplest form of process map. This powerful tool can be used in a variety of contexts to plan, visualize, document, and improve processes.
Industrial engineers Frank and Lillian Gilbright first introduced the concept of the flow chart in 1921, when they presented it to the American Society of Mechanical Engineers (ASME). Since then, flow charts have been improved and standardized to optimize processes across various industries.
If you want to learn more about the different types of flowcharts and their symbols, you've come to the right place. We'll also explain how you can create flowcharts and provide some examples for inspiration.
When should a flowchart be used?
Flowcharts can be useful in a variety of scenarios, including when you need to:
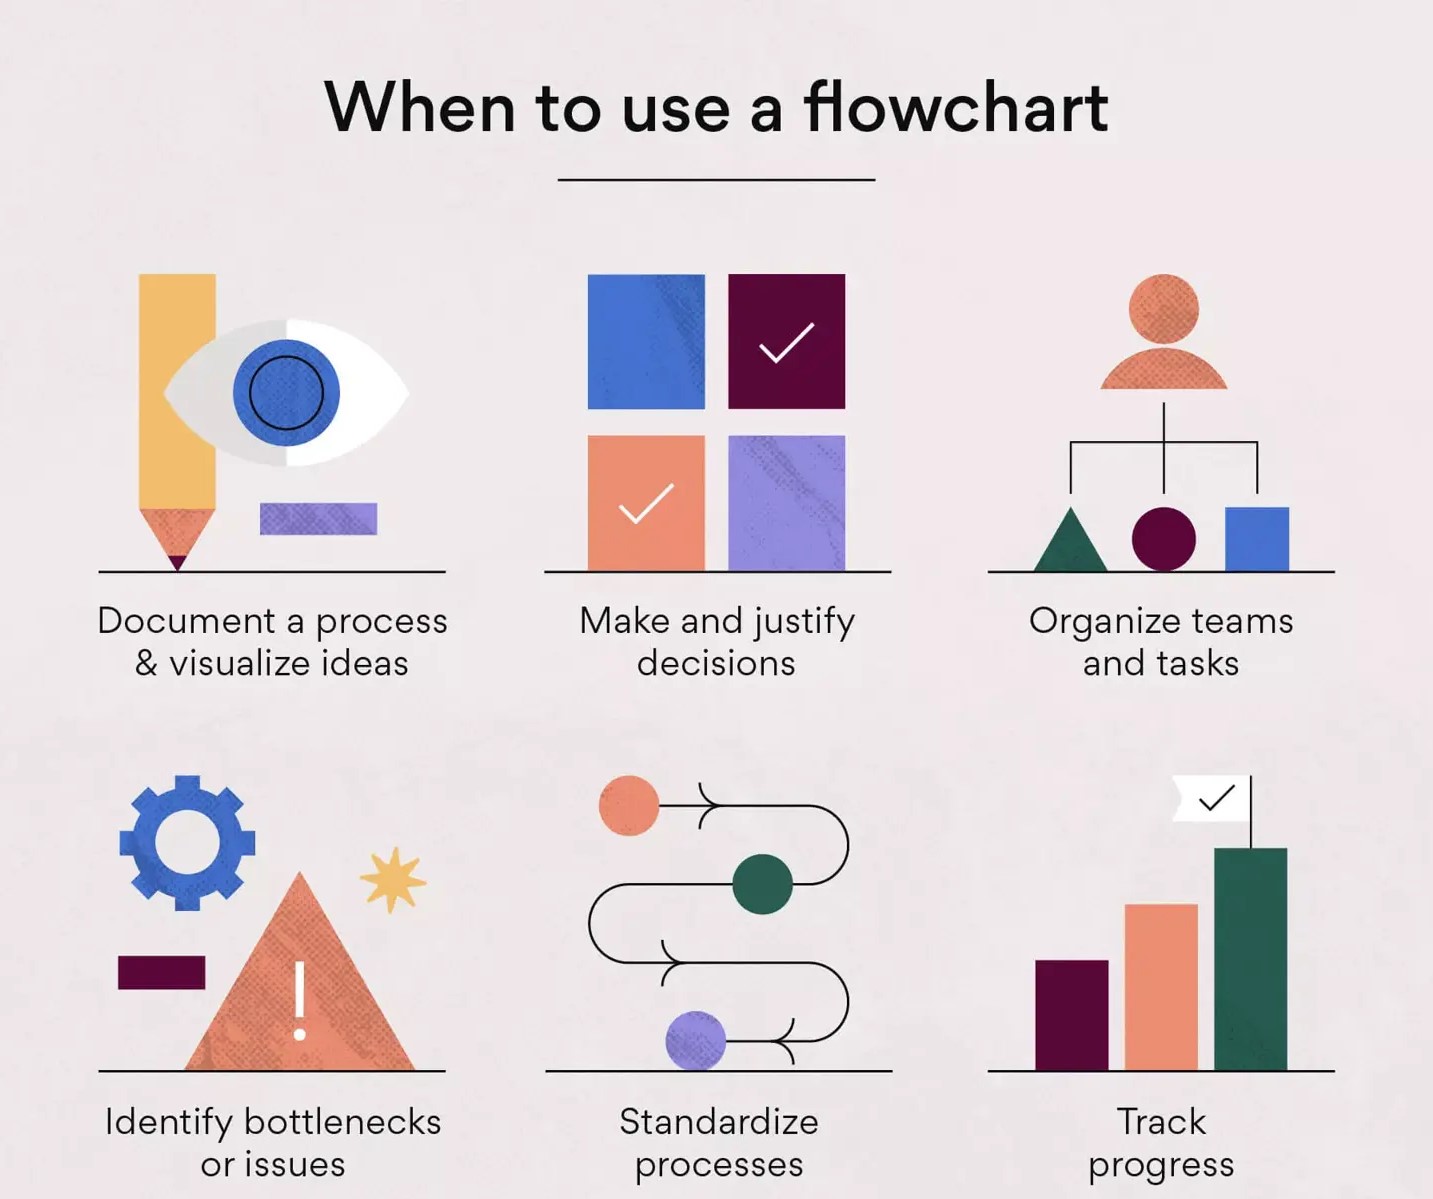
- Documenting and standardizing processes: A flowchart is a great way to map out and document a common project or process. Once you have the flowchart complete, you can use it for similar projects and processes. This can save you and your team time and stress in the long run.
- Visualizing complex ideas and systemsNot everyone on your team has the time (or resources) to study a complex, lengthy process document. A flowchart allows everyone to follow the workflow, understand the tasks, and analyze the different steps quickly and easily.
- Organizing teams and assigning tasksVisualizing a process can make it easier for you to assign tasks to your team members and organize your team's work so that everything flows better.
- Making data-driven decisionsDecisions often seem much less daunting and complicated when they are mapped out in a flowchart. A flowchart can also help you see the consequences of your decisions, which makes it easier to anticipate and justify next steps.
- Identifying and preventing bottlenecks: Flowcharts help you identify bottlenecks or problems before they become problems. By mapping out the entire process with this visual guide, you can follow each step and ensure you've allocated enough time and resources to each task.
- Planning and tracking project progress: Since it’s so easy to follow the steps in a flowchart, you can always identify where your team is in the project or process. This makes it very easy to track progress and also gives you a good overview of the tasks that still need to be done.
Flowchart symbols and definitions
Flowcharts range from quick, hand-drawn visualizations to help document or plan a process to complex workflow diagrams designed with specialized software. To make it easier for you to understand flowcharts across teams, departments, and even industries, the American National Standards Institute (ANSI) established formal standards in the 1960s, which were adopted by the International Organization for Standardization (ISO) in 1970, and have been continually updated and improved. The latest version of this standard was approved in 2019.
When reading a flowchart, follow the Western standard, which means you read it from top to bottom and left to right. Let's take a look at some of the most common flowchart shapes, symbols, names, and meanings.
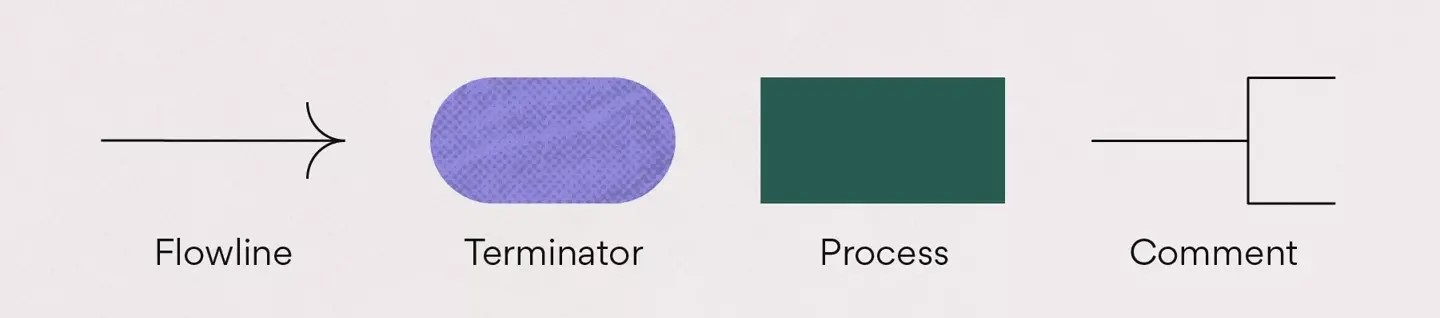
- Flow line: The flow line shows the direction of the process by connecting two blocks together.
- End or Terminator: The terminator symbol indicates the start or end points of a process in a flowchart.
- Process: The process symbol is the most common component of a flowchart and represents a step in a process.
- Explanation or annotation: You can show additional information about a step with a description or annotation.

Decision-making:
This symbol represents a decision that you or your team must make to get to the next step in the process. It is usually a right or wrong decision or a yes or no question that you must answer.
Stored data:
This symbol means a data file or database.
“Or” symbol:
This symbol indicates that the process flow continues in three or more branches.
Input/Output:
The input/output symbol represents the process of importing or exporting external data.
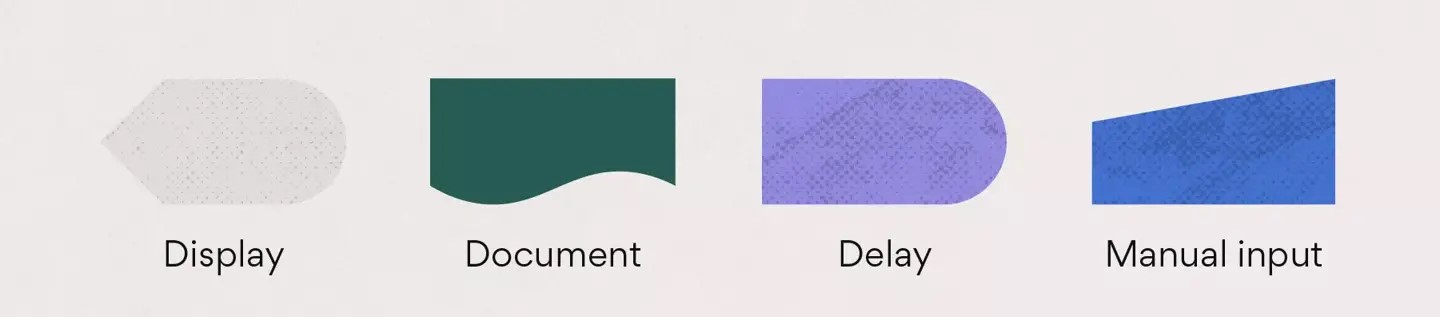
Show:
This icon indicates a step that displays relevant information.
Document:
This symbol represents a single document.
Delay:
This icon allows you to schedule and display any delay periods that are part of the process.
Manual input:
This symbol indicates data or information that must be entered manually.
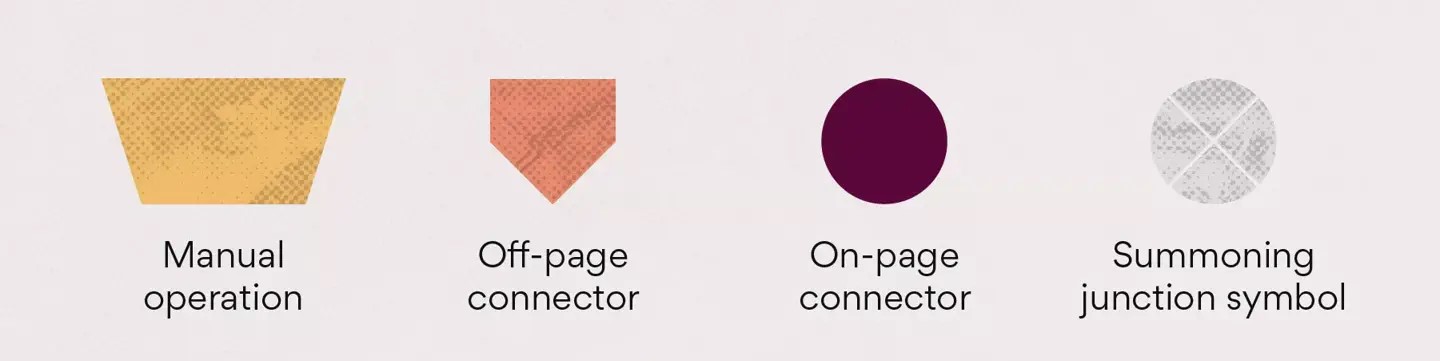
Manual operation:
This symbol indicates a manual operation or manual adjustment in the process.
Off-screen connector:
This symbol is used to connect two symbols that are on different pages.
In-page connector:
This dot can connect two symbols and replace long lines, making the flowchart cleaner and more organized.
Intersection connection symbol:
This symbol is used to converge multiple branches into a single process.

Alternative process:
The lines associated with this symbol are usually dotted. The symbol itself indicates an alternative to the normal process step, if one is needed.
Predefined process:
This symbol represents a process that has already been defined elsewhere.
Several documents:
This icon represents multiple documents.
Preparation or initiation:
This symbol represents a preparatory or beginning stage in the process.
Once you learn what the symbols mean, you can read or create almost any type of flowchart and gain a better understanding of the process being visualized. When creating a flowchart that requires different shapes or symbols, include a legend so that it remains accessible to team members.
Common types of flowcharts
Flowcharts come in many different types, each serving a specific purpose in visualizing and analyzing different aspects of a process or system. Understanding the common types of flowcharts can help you choose the best option for your needs, whether you're documenting a workflow, designing an algorithm, or managing a complex project. Here are some of the most common types of flowcharts:
Decision-making flow chart
A decision flow chart focuses on the decision-making process and maps out different paths and outcomes based on specific conditions or criteria. It helps teams evaluate and improve their decision-making strategies.
Process flow chart
A process flow diagram, also known as a process flow chart or process map, provides a step-by-step representation of a process, showing the order in which tasks are performed, decision points, and end points. It is useful for documenting, analyzing, and optimizing business processes.
Workflow diagram
A workflow diagram shows the flow of work and information between people, departments, or systems. It helps streamline processes, identify bottlenecks, and ensure effective collaboration between team members.
Swimlane Flowchart
This type of flowchart, also called a cross-functional flowchart or swimlane diagram, divides the process steps into separate lines that represent different people or roles. It is ideal for visualizing complex processes that involve multiple stakeholders.
Data Flow Diagram (DFD)
A data flow diagram (DFD) depicts the flow of data in a system and shows how data is processed, stored, and transmitted. DFDs are commonly used in computer programming and systems analysis to design and document information systems.
Program Flowchart
A program flow diagram shows the sequence of steps and decisions in a computer program or algorithm. It helps programmers design, document, and debug software.
System flow chart
A system flow diagram shows the architecture and components of a system, including hardware, software, and their interactions. It is useful for designing, documenting, and debugging complex systems.
Process Flow Diagram (PFD)
Similar to a process flow diagram, a process flow diagram (PFD) provides an overview of a process that focuses on the main equipment, material flow, and control loops. This type of diagram is commonly used in chemical engineering and industrial processes.
Event-driven process chain (EPC) diagram
An event-driven process chain (EPC) diagram is a specific type of diagram used to model business processes based on events, functions, and logical connections. EPCs are commonly used in conjunction with other process modeling techniques such as BPMN (Business Process Modeling and Notation).
Specification and Description Language (SDL) Diagram
SDL diagrams are used to design and document real-time systems, particularly in the telecommunications industry. They provide a graphical representation of a system's behavior, including states, transitions, and actions.
By understanding these common types of flowcharts and their uses, you can choose the best diagram for your project, whether you use a flowchart template, a flowchart builder, or create one from scratch.
Tip: You can find a process documentation flow chart in our article on process documentation and see PERT charts as another common example of flow charts.
Read: Incident Management: How to Create a Plan (Plus 7 Best Practices)
How to Create a Flowchart: A Step-by-Step Guide
Creating a flowchart may seem daunting at first, but by following these simple steps, you can easily visualize your processes, workflows, or algorithms using a flowchart builder or software. Whether you're creating process diagrams, decision flow diagrams, or swimlane diagrams, this guide will help you get started.
1. Define your goal and scope.
Before you start creating a flowchart, clearly define its purpose and scope. Are you documenting a business process, designing an algorithm, or visualizing a complex workflow? Understanding your purpose will help you choose the right type of flowchart and determine the level of detail required.
2. Identify and organize tasks
Gather information about the process, workflow, or system you want to visualize. Meet with team members and stakeholders to identify key steps, decision points, inputs, and outputs. Use a whiteboard or sticky notes to organize your ideas and create a first draft of your flowchart that outlines the main steps and structure.
3. Choosing the right flowchart symbols
Familiarize yourself with standard flowchart symbols and shapes, including connections, decision points, and endpoints. Choose the most appropriate symbols based on the type of flowchart you are creating, such as a process flow diagram, data flow diagram (DFD), or swimlane diagram. Consistent use of symbols ensures clarity and readability of the diagram.
4. Draw and complete your flow chart
Use a flowchart maker or software like Microsoft Visio or Lucidchart to create a digital, completed version of your flowchart. These tools offer a wide range of templates, shapes, and connectors that make it easy to create professional flowcharts for a variety of uses. Arrange the steps and decision points logically, and use connectors to show the flow between them. Add descriptions and labels to provide context and clarity.
5. Implementation and Optimization
Share your completed flowchart with team members and stakeholders and get feedback. Collaborate to ensure everyone understands the process or workflow represented in the flowchart. Implement the flowchart in your organization and monitor its effectiveness. Continually review and optimize your flowchart based on real-world experiences and feedback, making adjustments as needed to improve efficiency and productivity.
Result
By following these steps and leveraging the power of flowchart software and templates, you can create clear and effective flowcharts that help streamline your processes, workflows, and decision-making.