Introduction
In this tutorial, you will learn how to collect aggregated metrics for a PostgreSQL database managed on DigitalOcean using a web application deployed on the DigitalOcean App Platform.
You will use a sample Node.js application for this demonstration and connect it to the Managed DigitalOcean PostgreSQL database that you will create in this tutorial.
At the end of this tutorial, you will have a Prometheus dashboard that scrapes and displays metrics from a managed PostgreSQL database connected to an App Platform web application.
Prerequisites
Before you begin, make sure you have the following prerequisites:
- A DigitalOcean account.
- A sample Node.js application deployed on the App Platform.
- The Postgres database has been deployed and connected to the App Platform application.
- A personal access token created with read/write (rw) access. You can follow this tutorial on how to create a personal access token to create one for yourself.
Step 1 – Setting up a managed PostgreSQL database
Let's start by creating a PostgreSQL database.
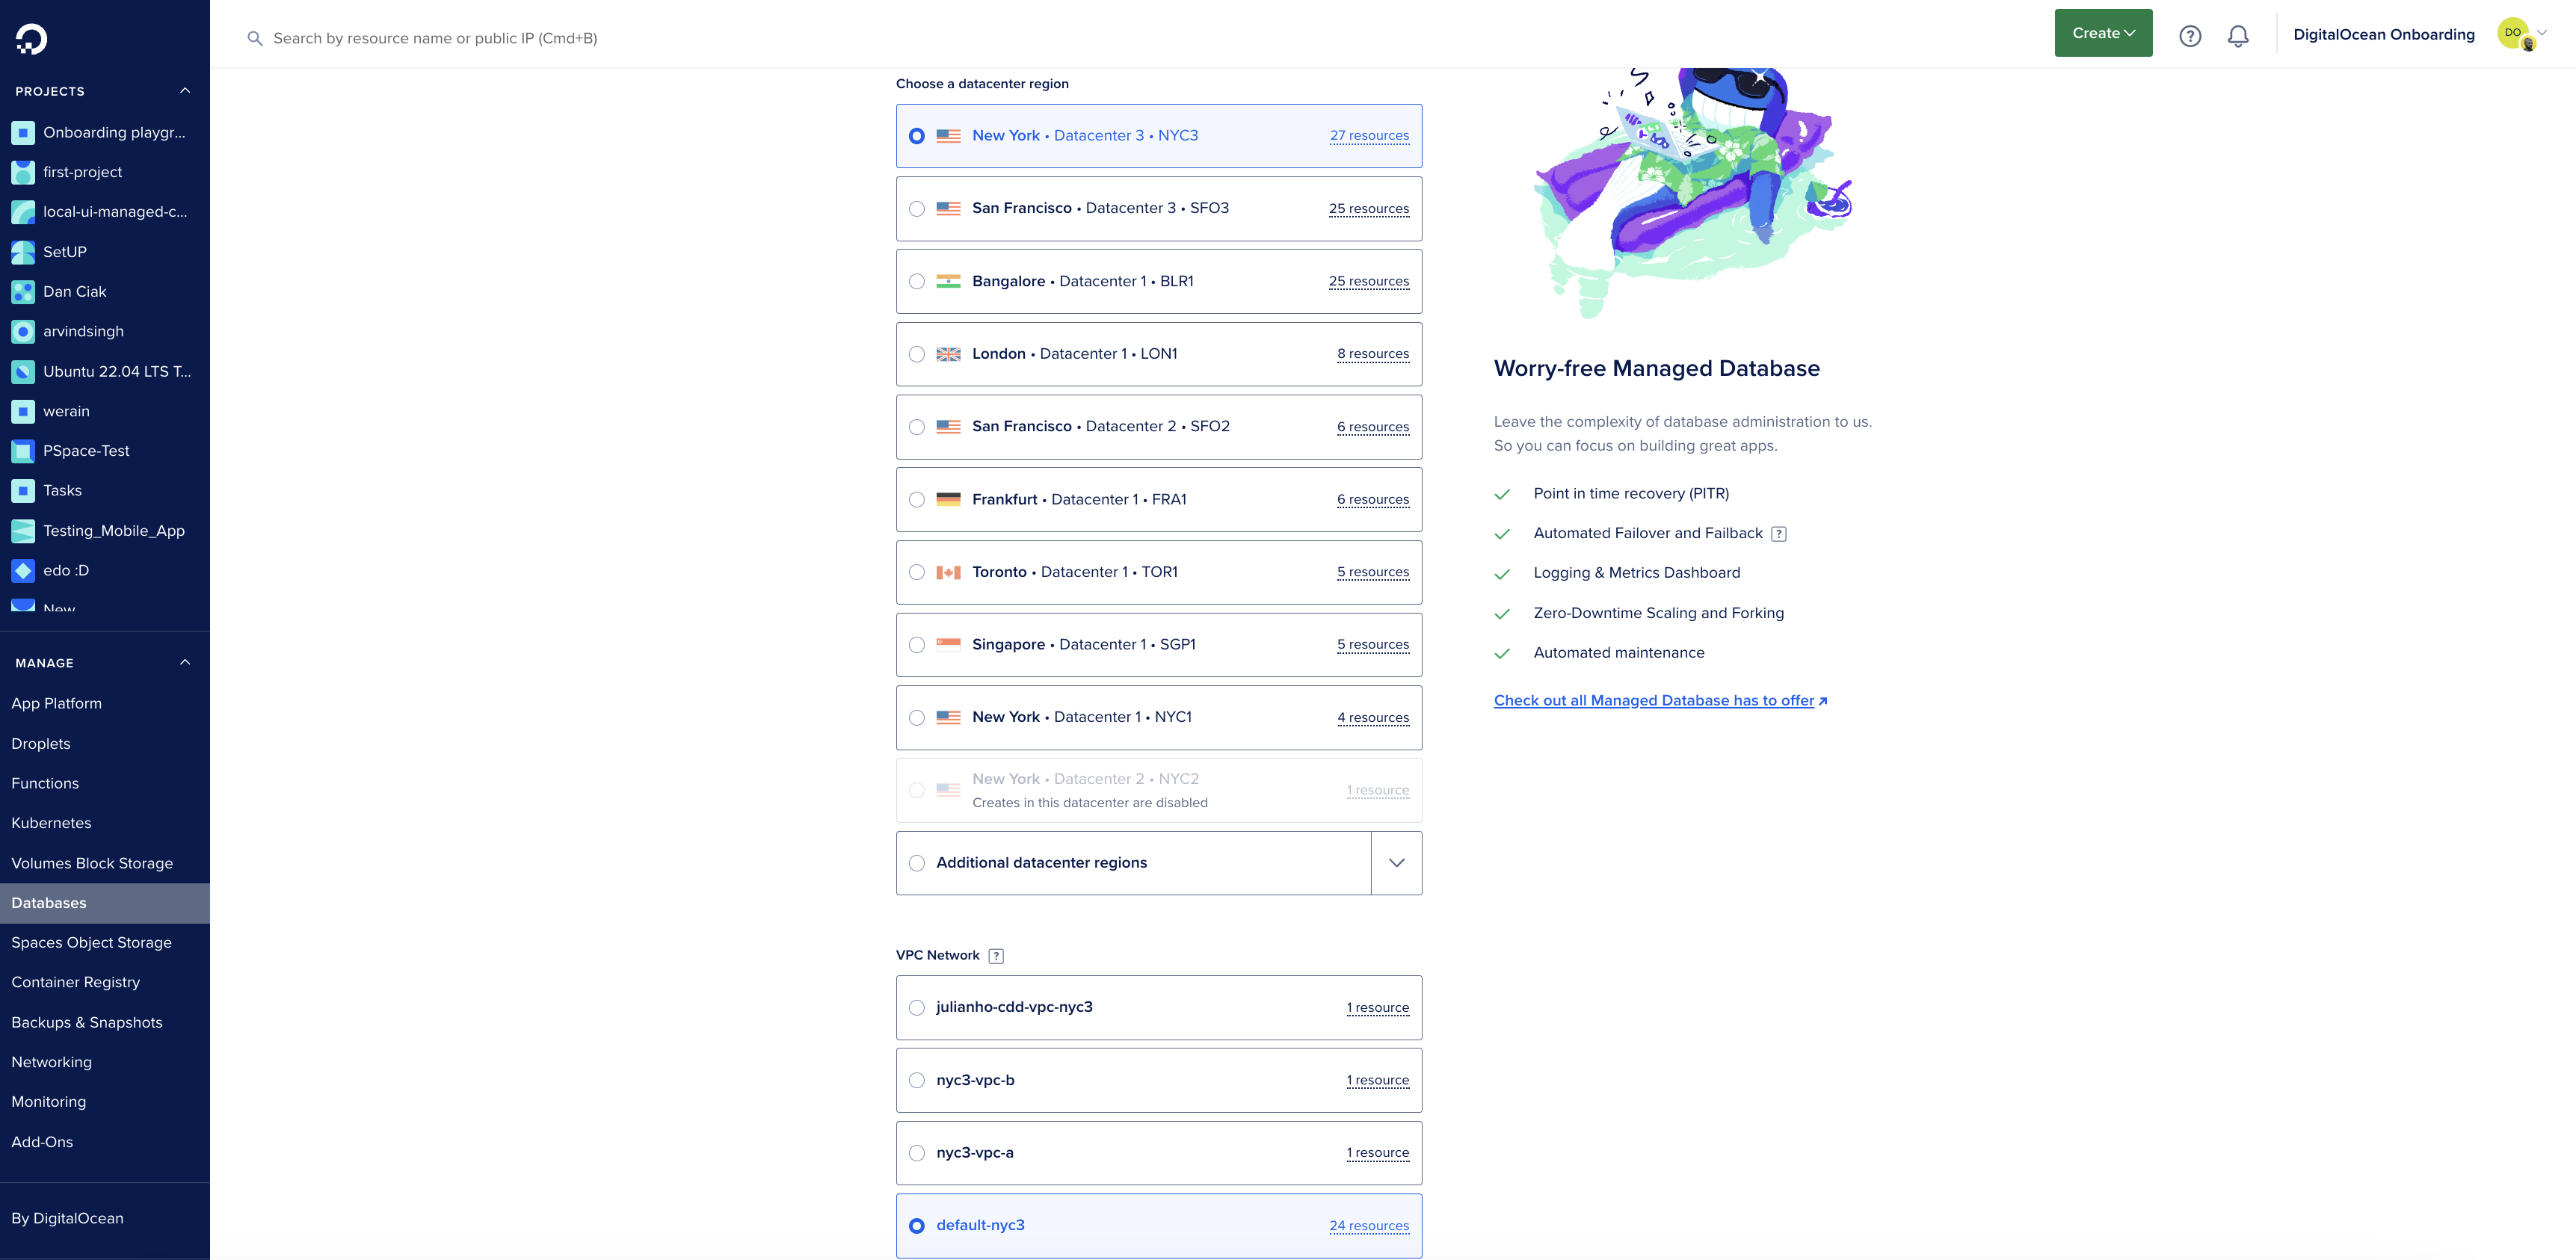
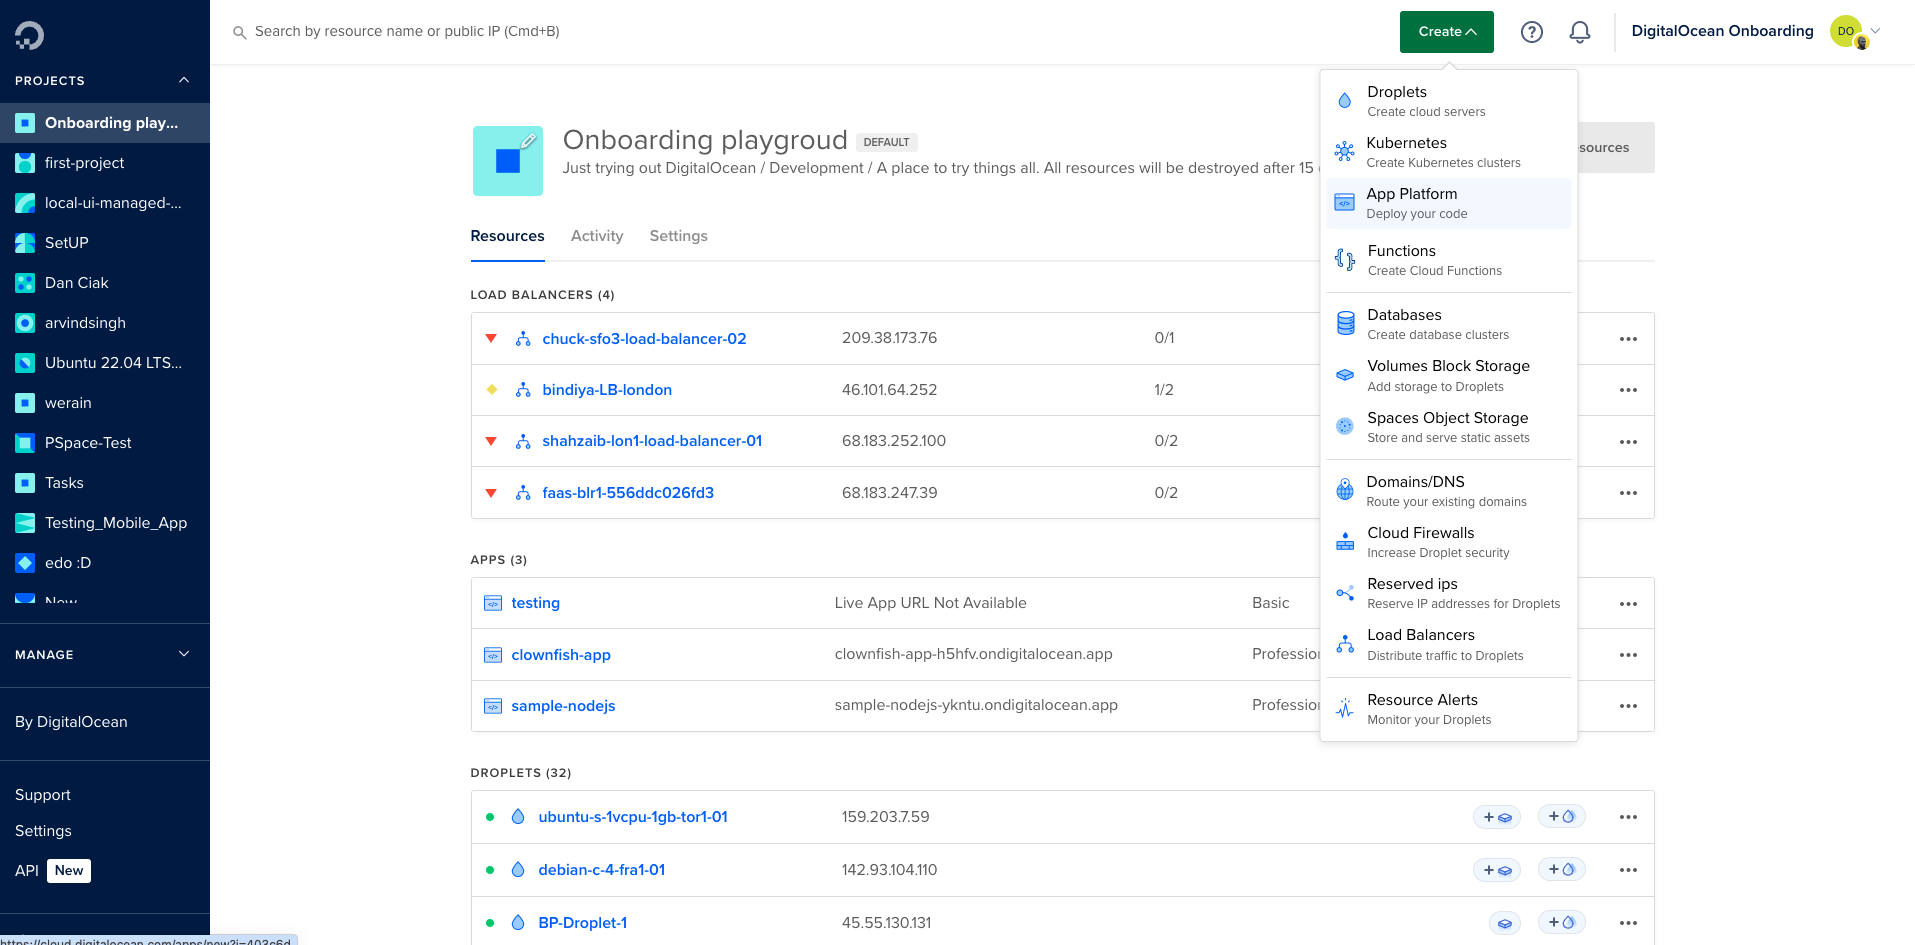
Go to the Databases section in your DigitalOcean cloud control panel.
Click on “Create Database Cluster” and select PostgreSQL. You need to select a data center region and a VPC network, as shown in the image below:
Next, select PostgreSQL as the database and choose other settings for your database.
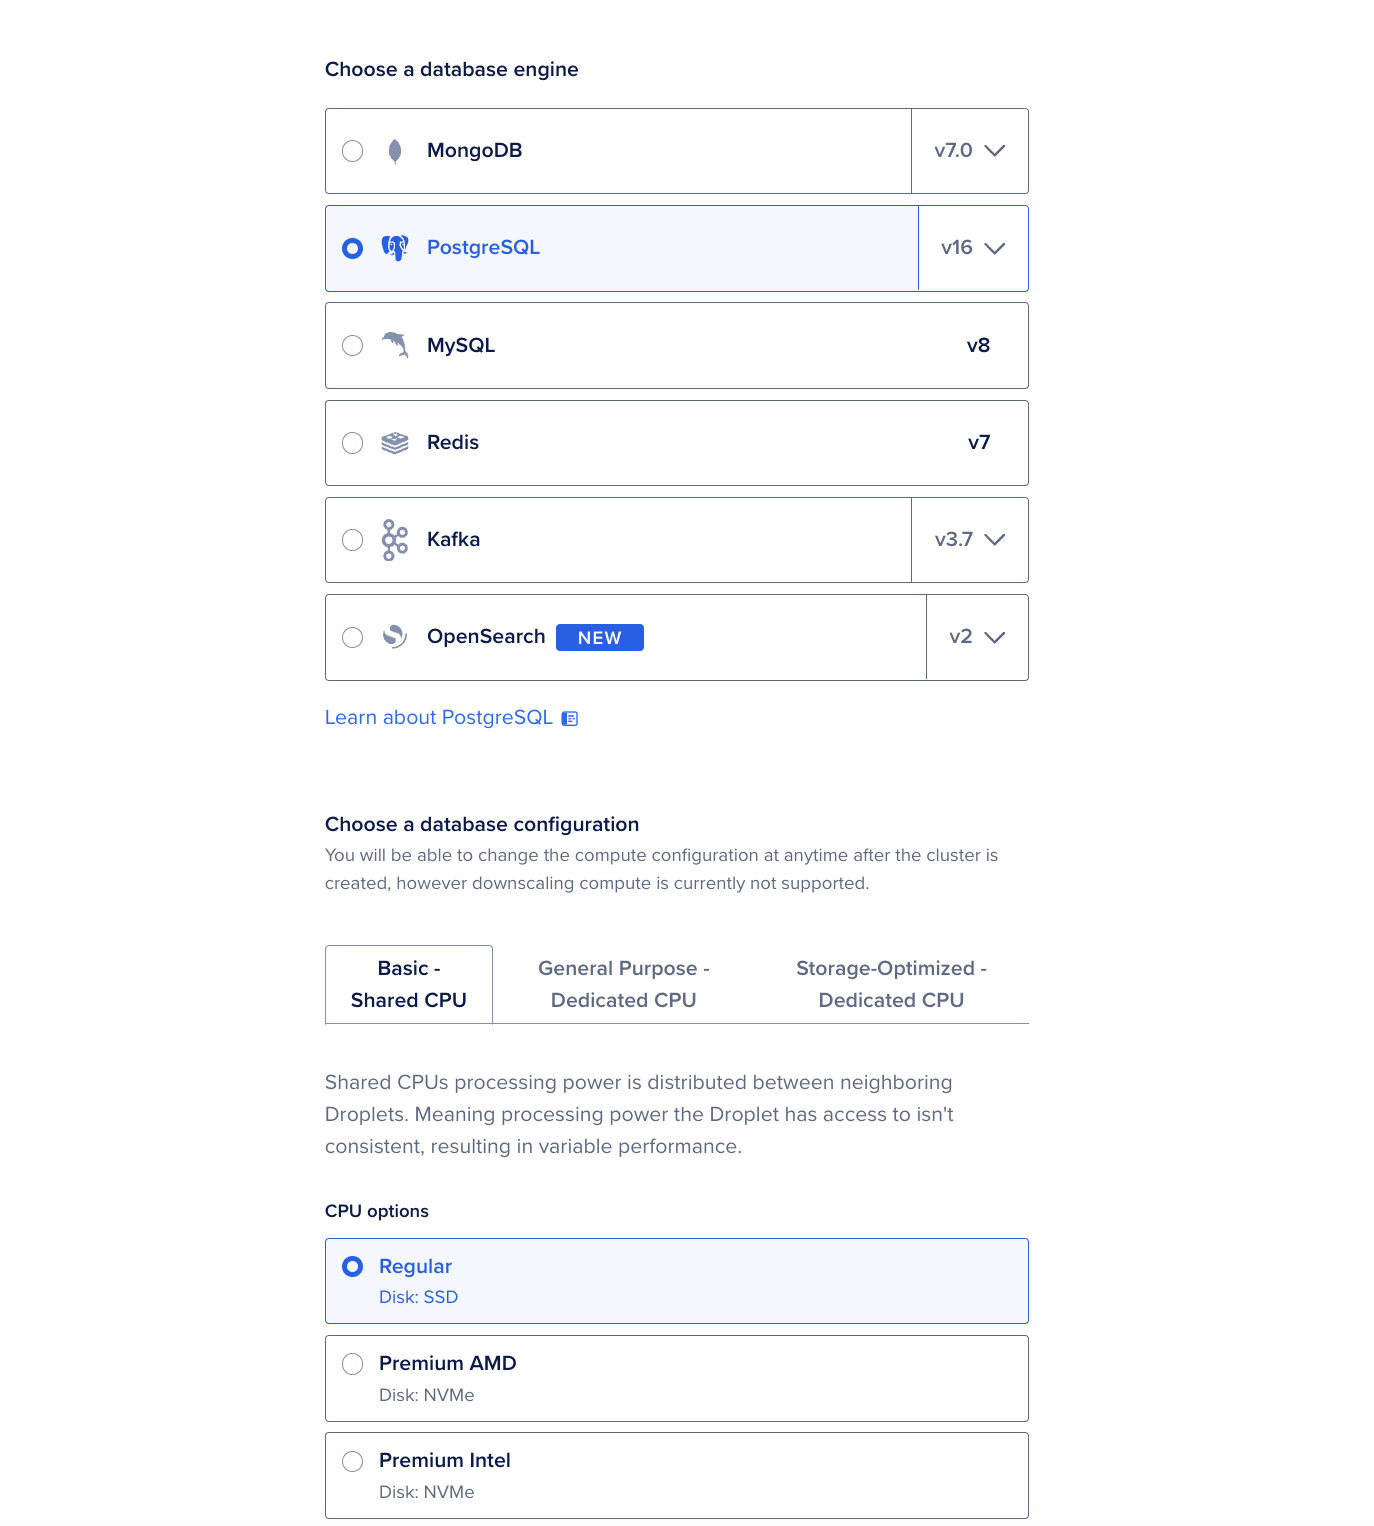
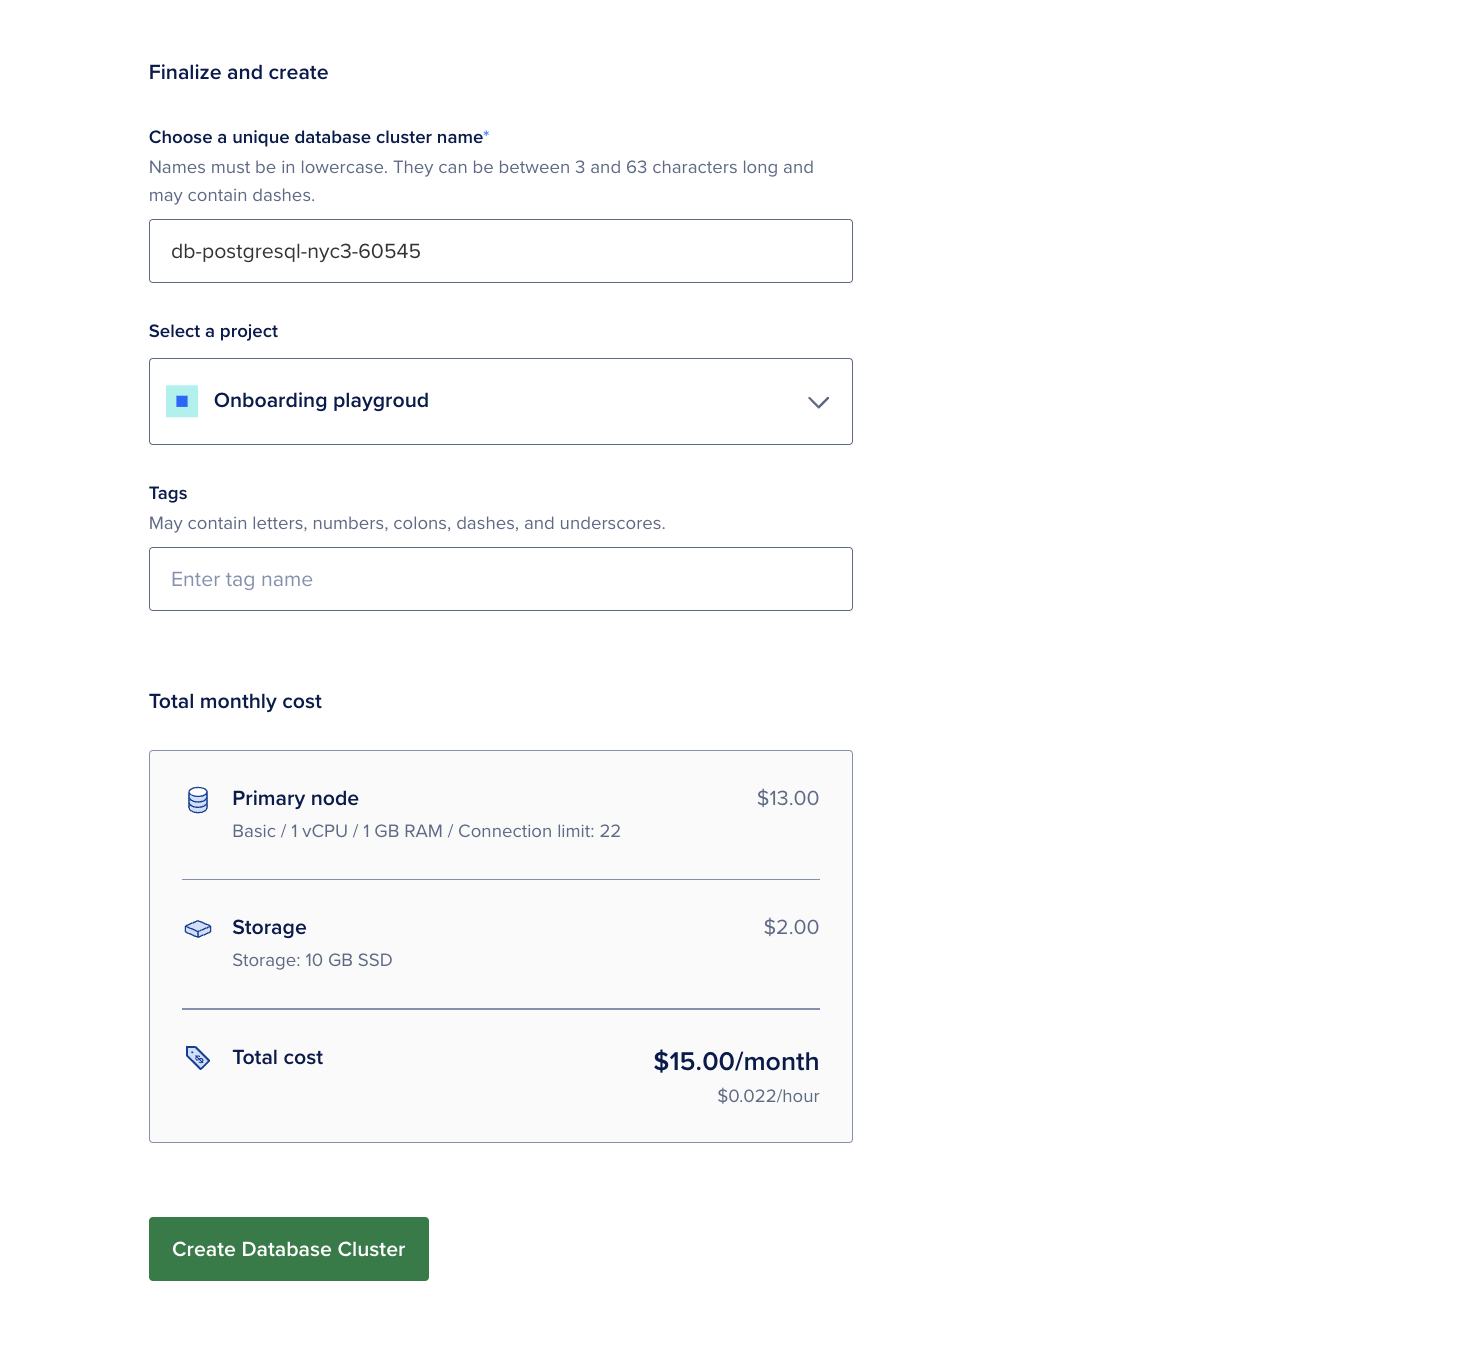
Configure the database settings, follow the on-screen instructions, and click Create Database cluster.
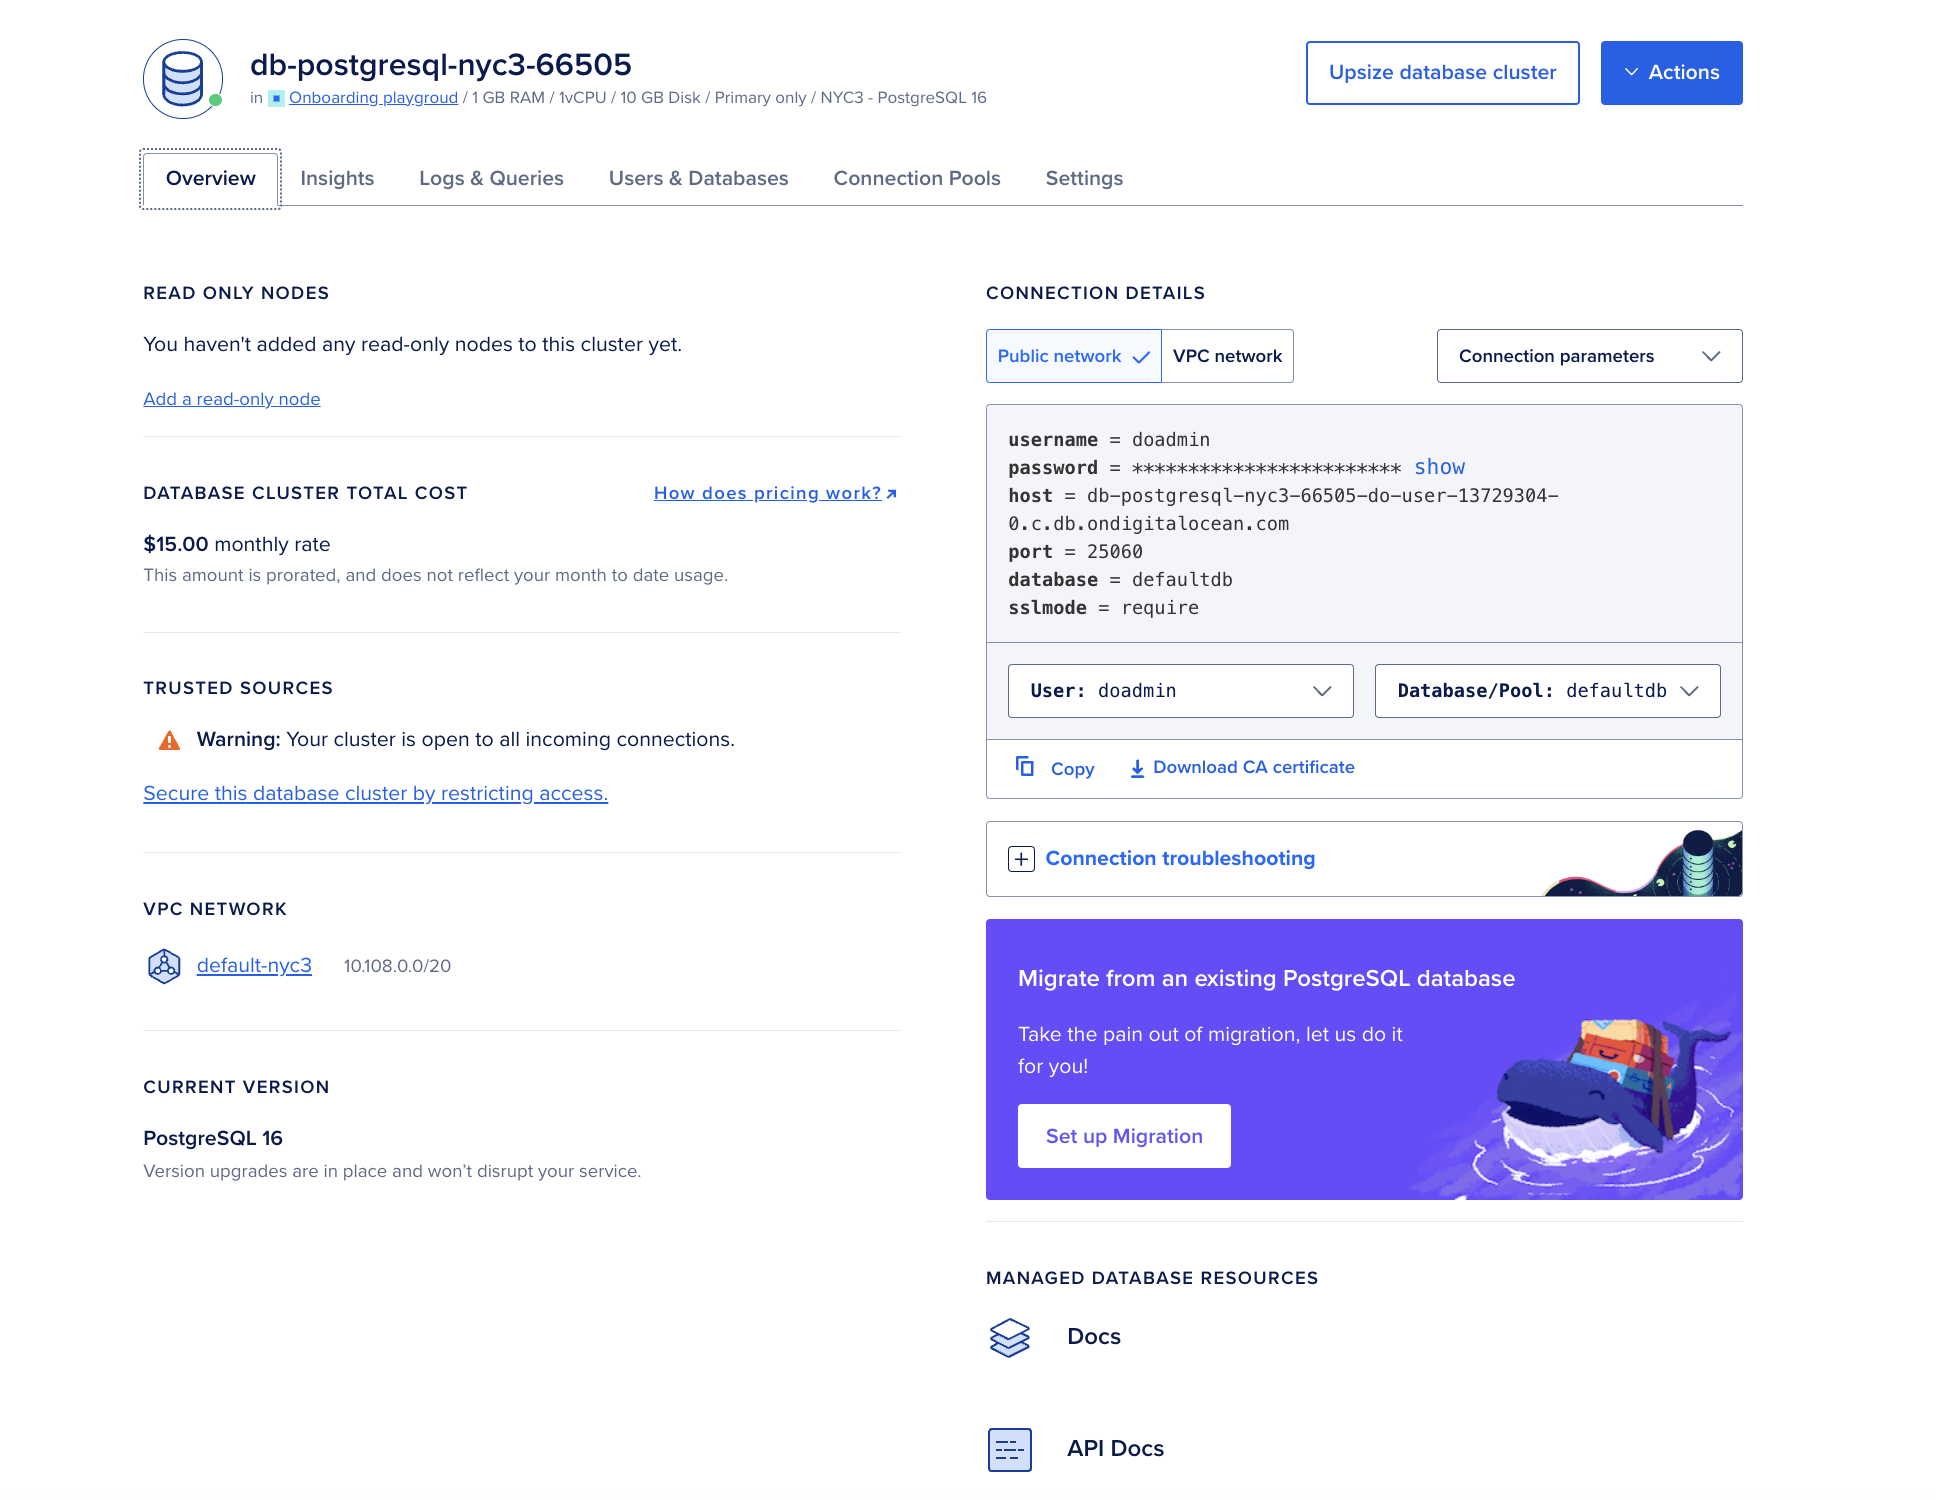
Once the PostgreSQL managed database cluster is created, you can review its overview, insights, reports, as well as settings in the following tabs:
Step 2 – Deploy a Node.js web application instance on the application platform
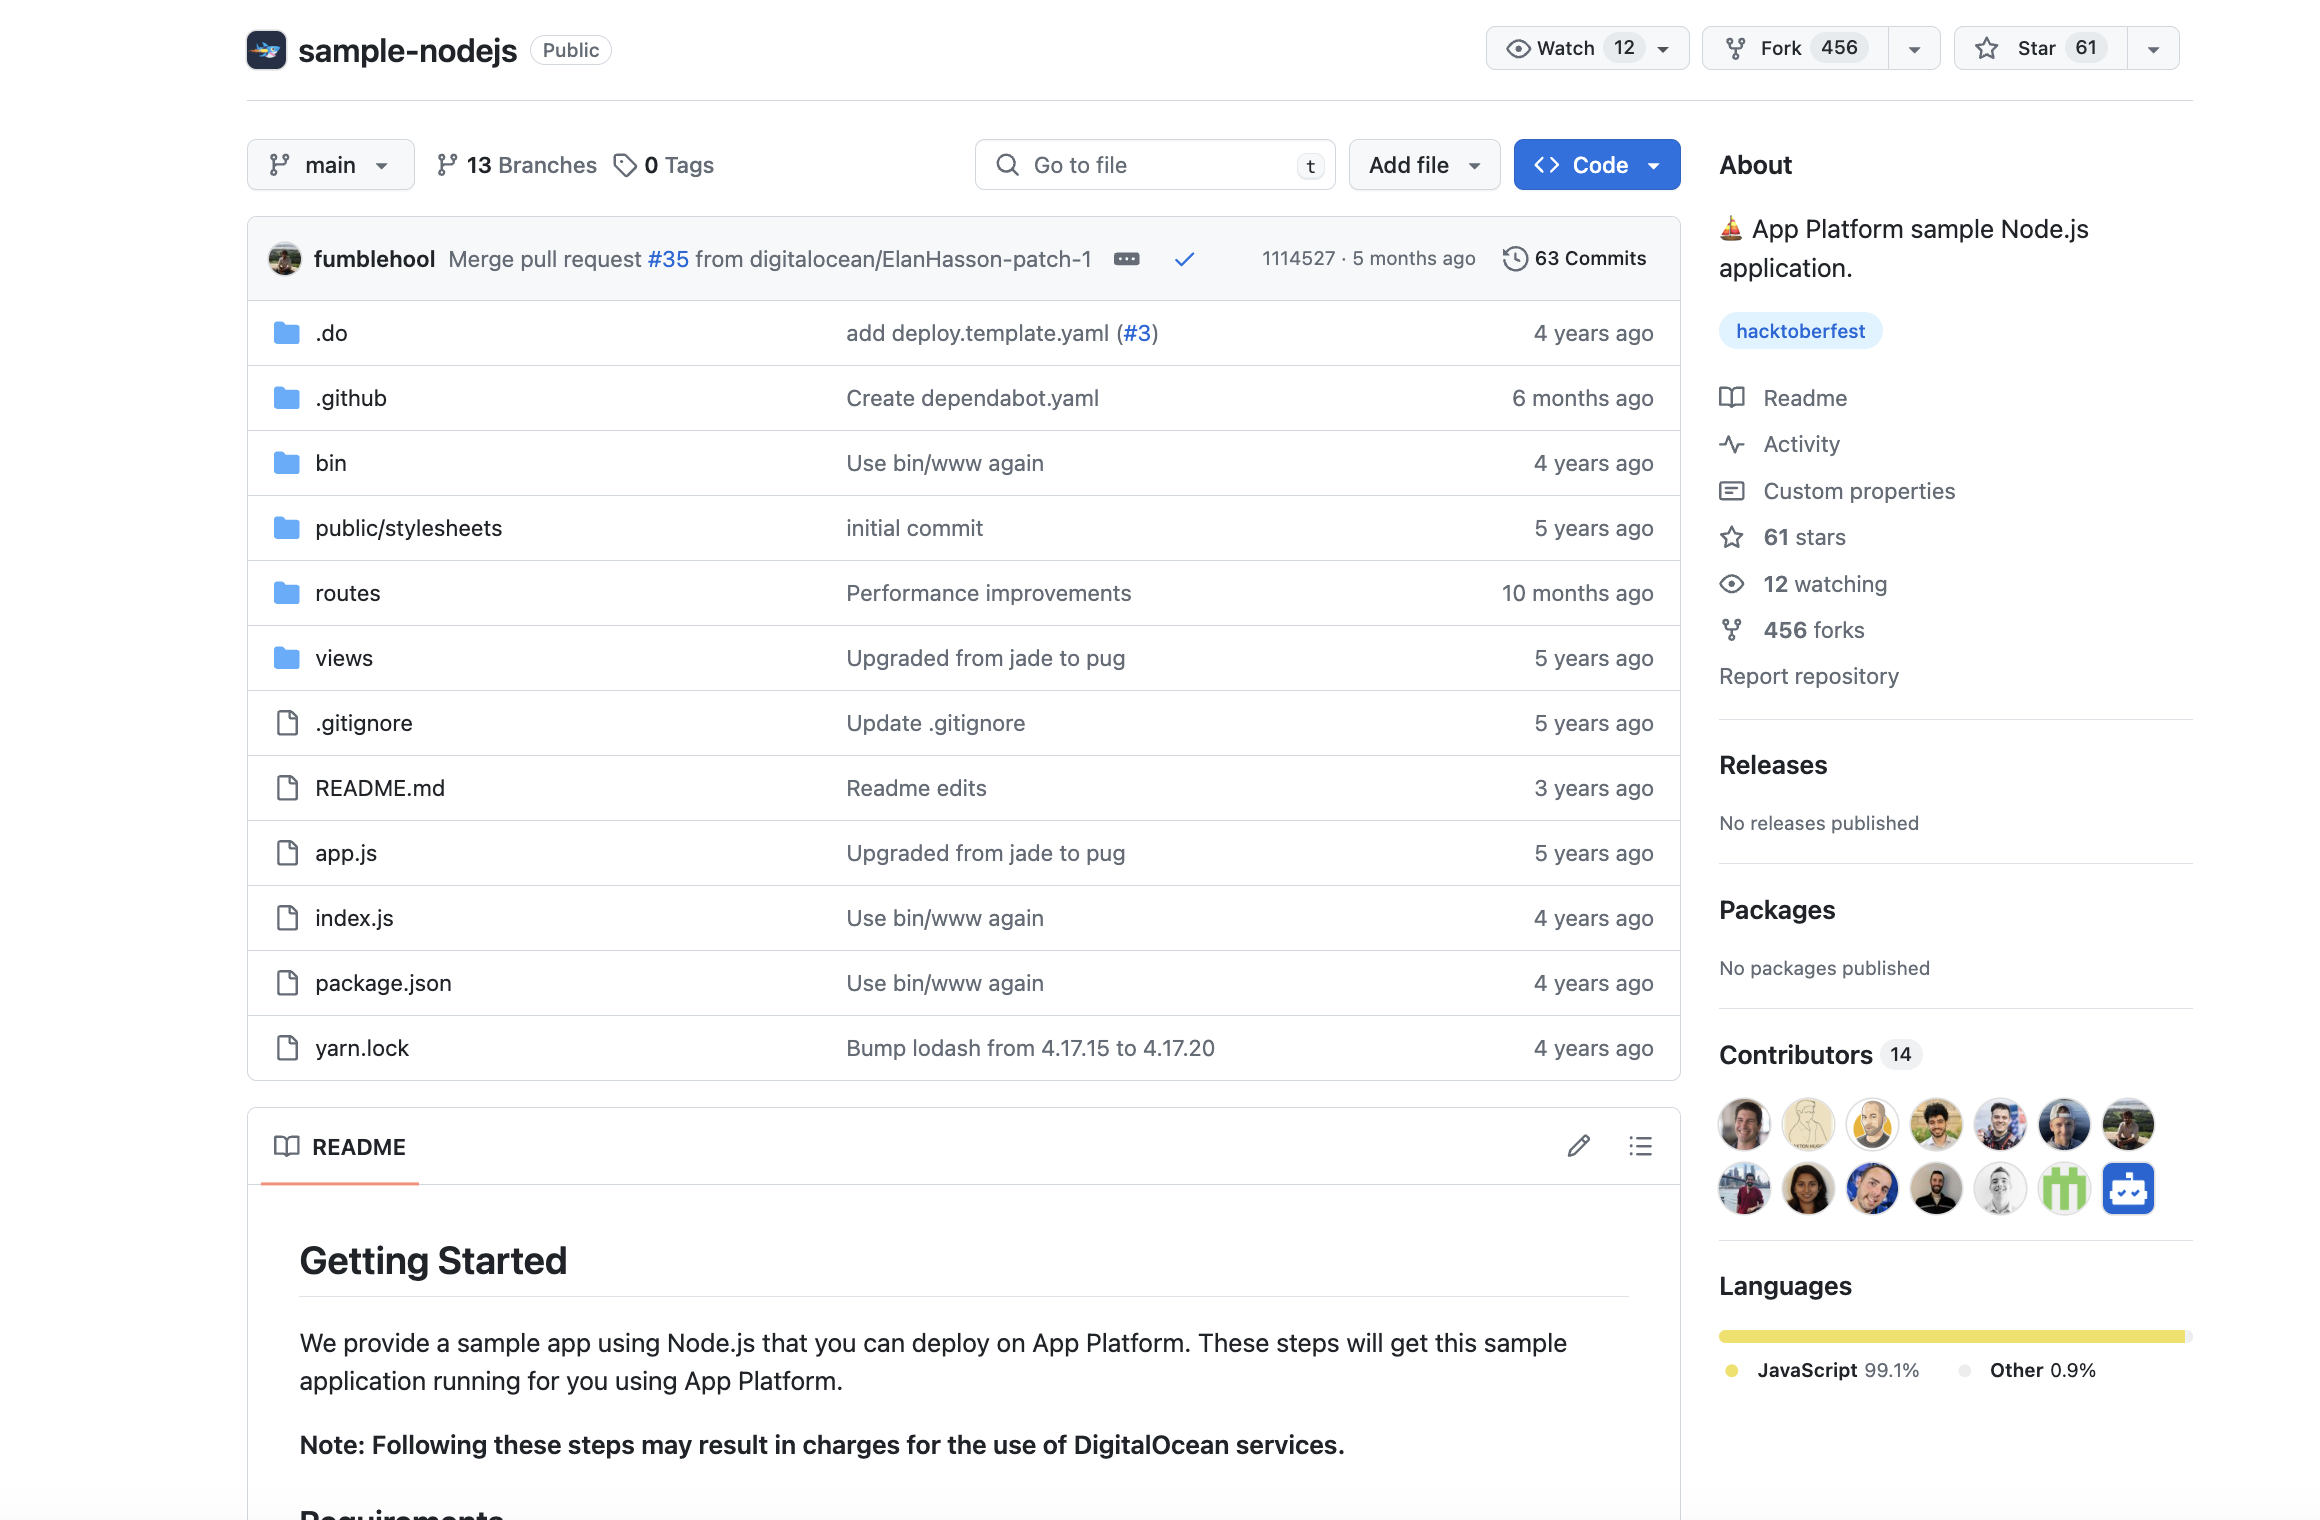
You can follow the steps to deploy a Sample Node.js app or use this github repository to create a sample Node.js app on the App Platform.
If you use the latter, you need to fork this GitHub repository to your Github account to store a copy in the cloud. Click the Fork button on the GitHub repository and follow the on-screen instructions.
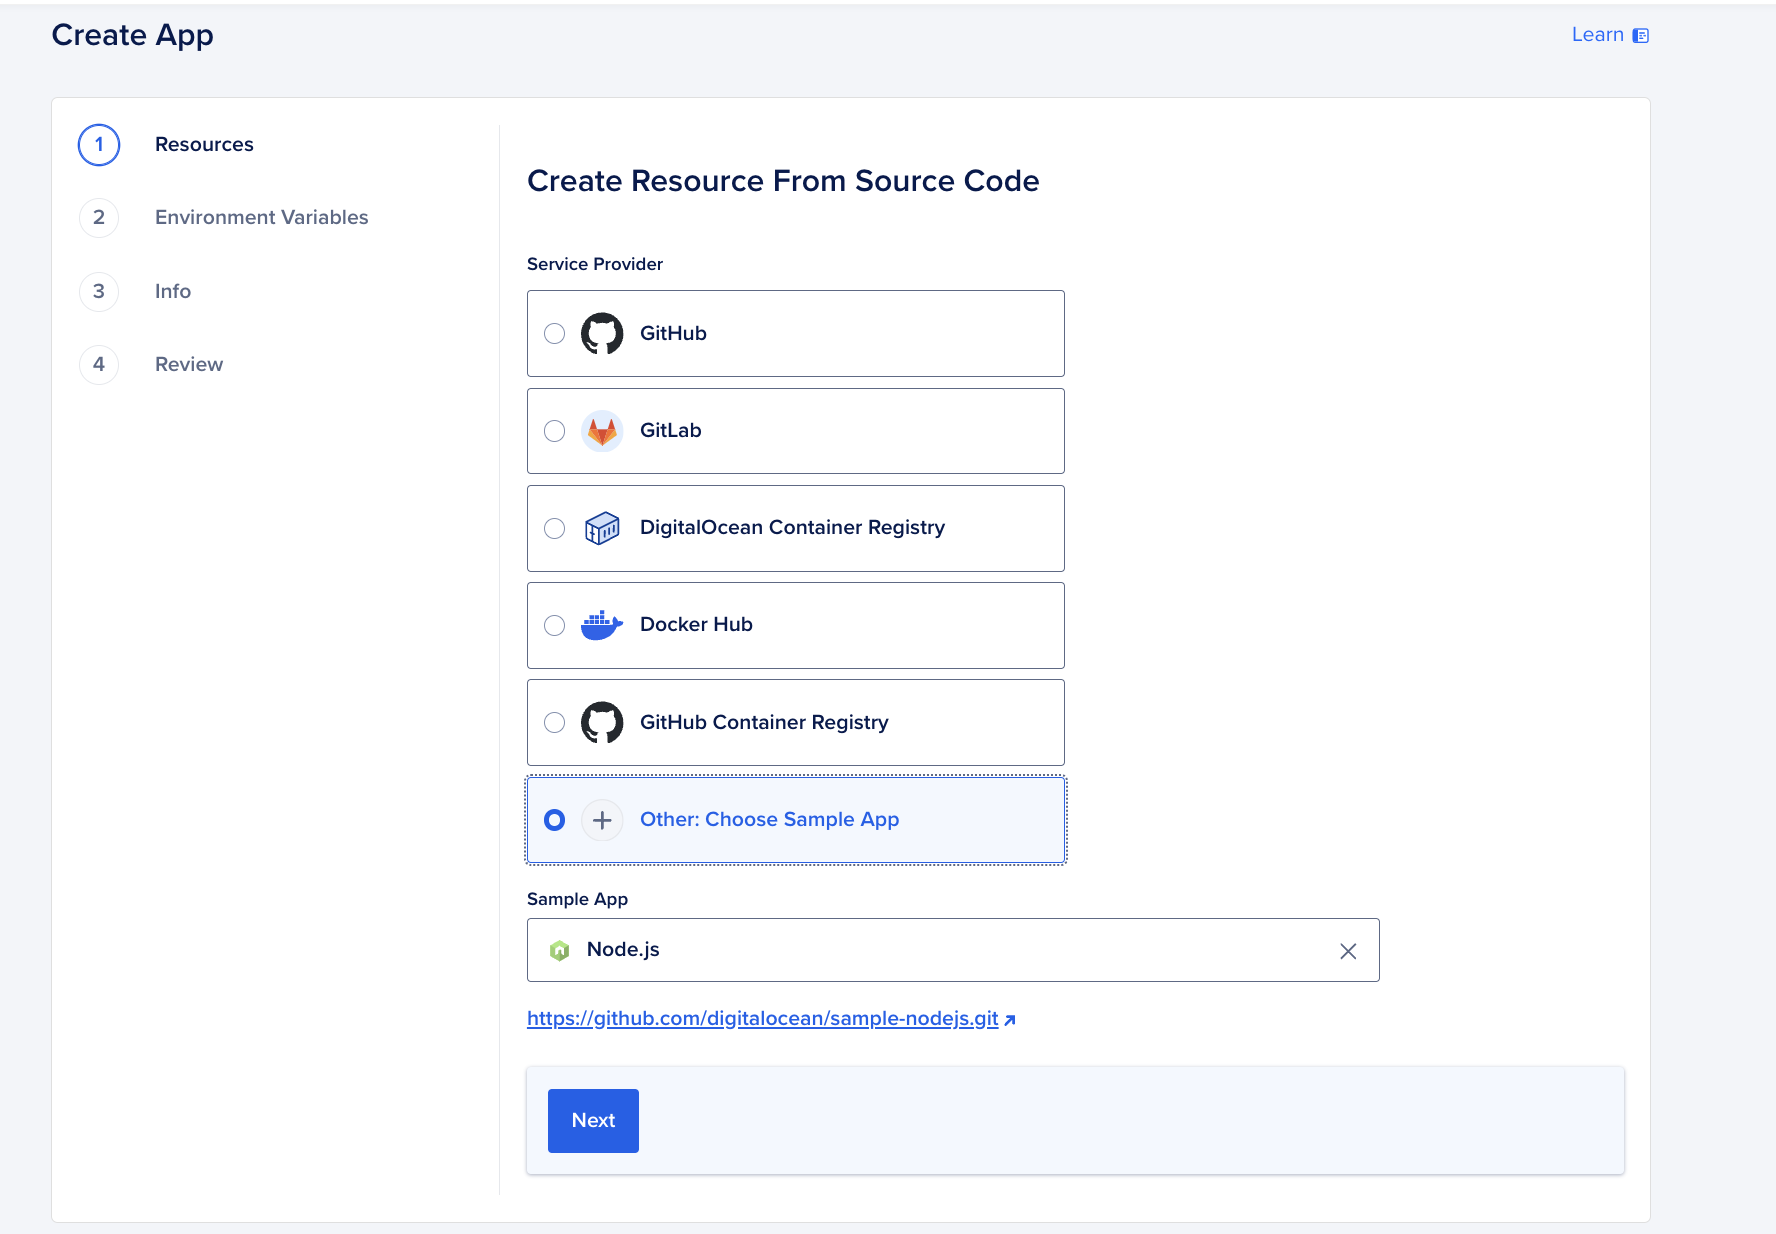
Now log in to the DigitalOcean cloud portal and navigate to Create App -> App Platform.
Then, under "Other: Select a sample app," select the Node.js sample app from the Sample App drop-down menu, and click Next.
Follow the on-screen instructions to set up the application resources, general configuration, and environment variables, and click Next. Once done, review the general application configuration. When finished, click Create Resources. After creating the application, it will take some time for it to be deployed to the application platform.
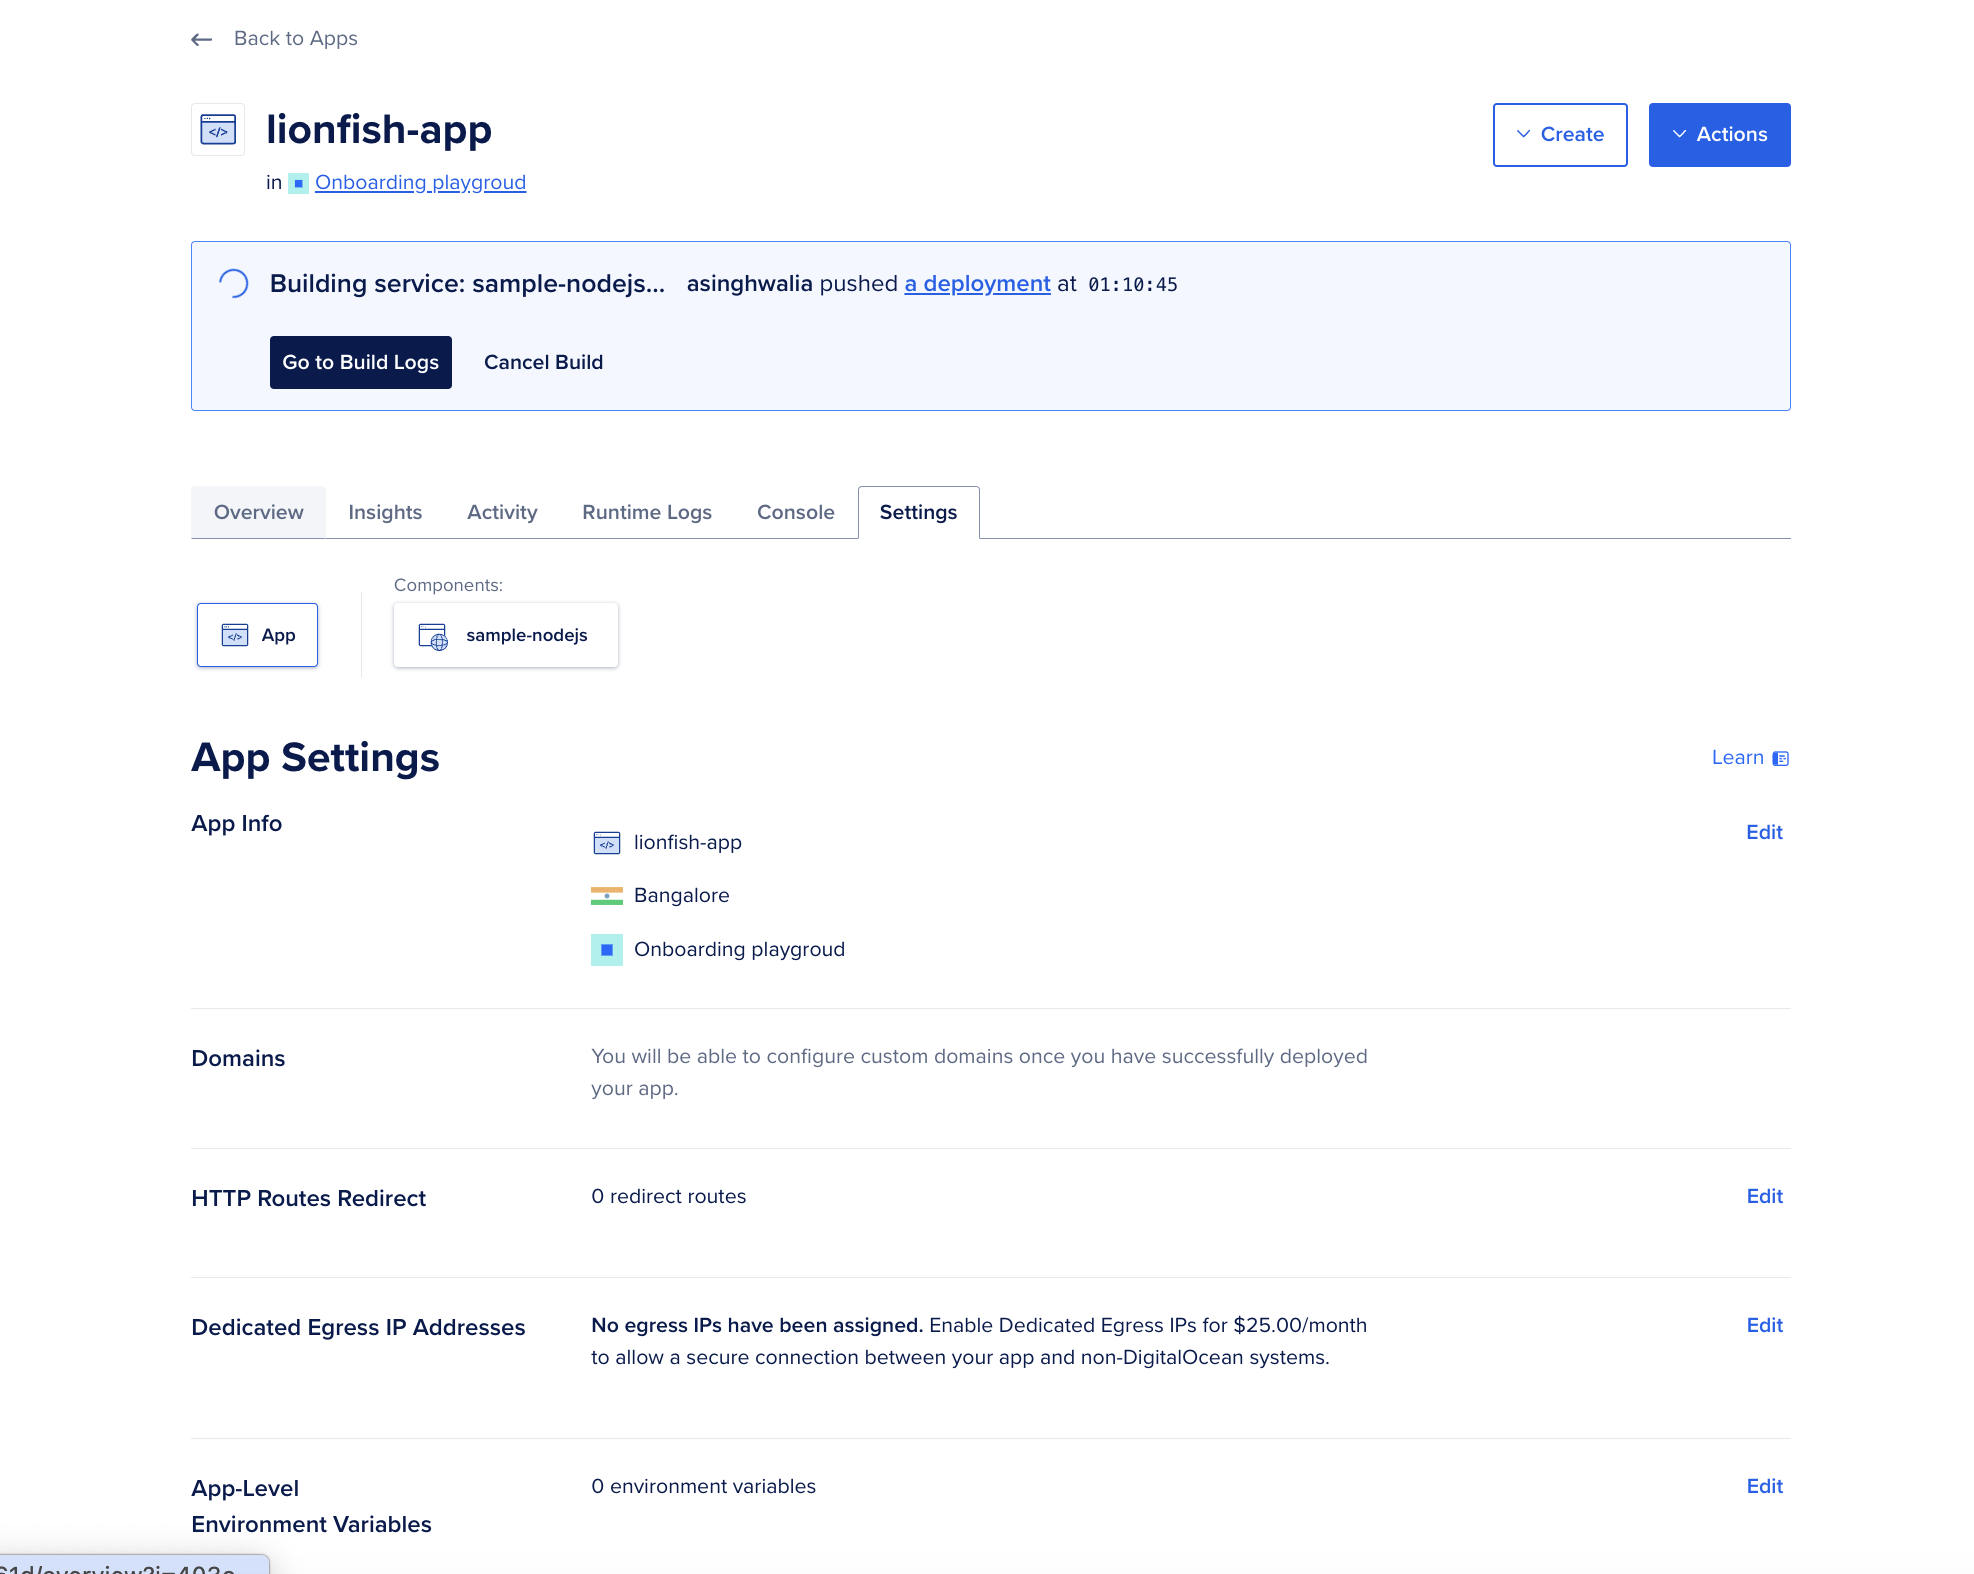
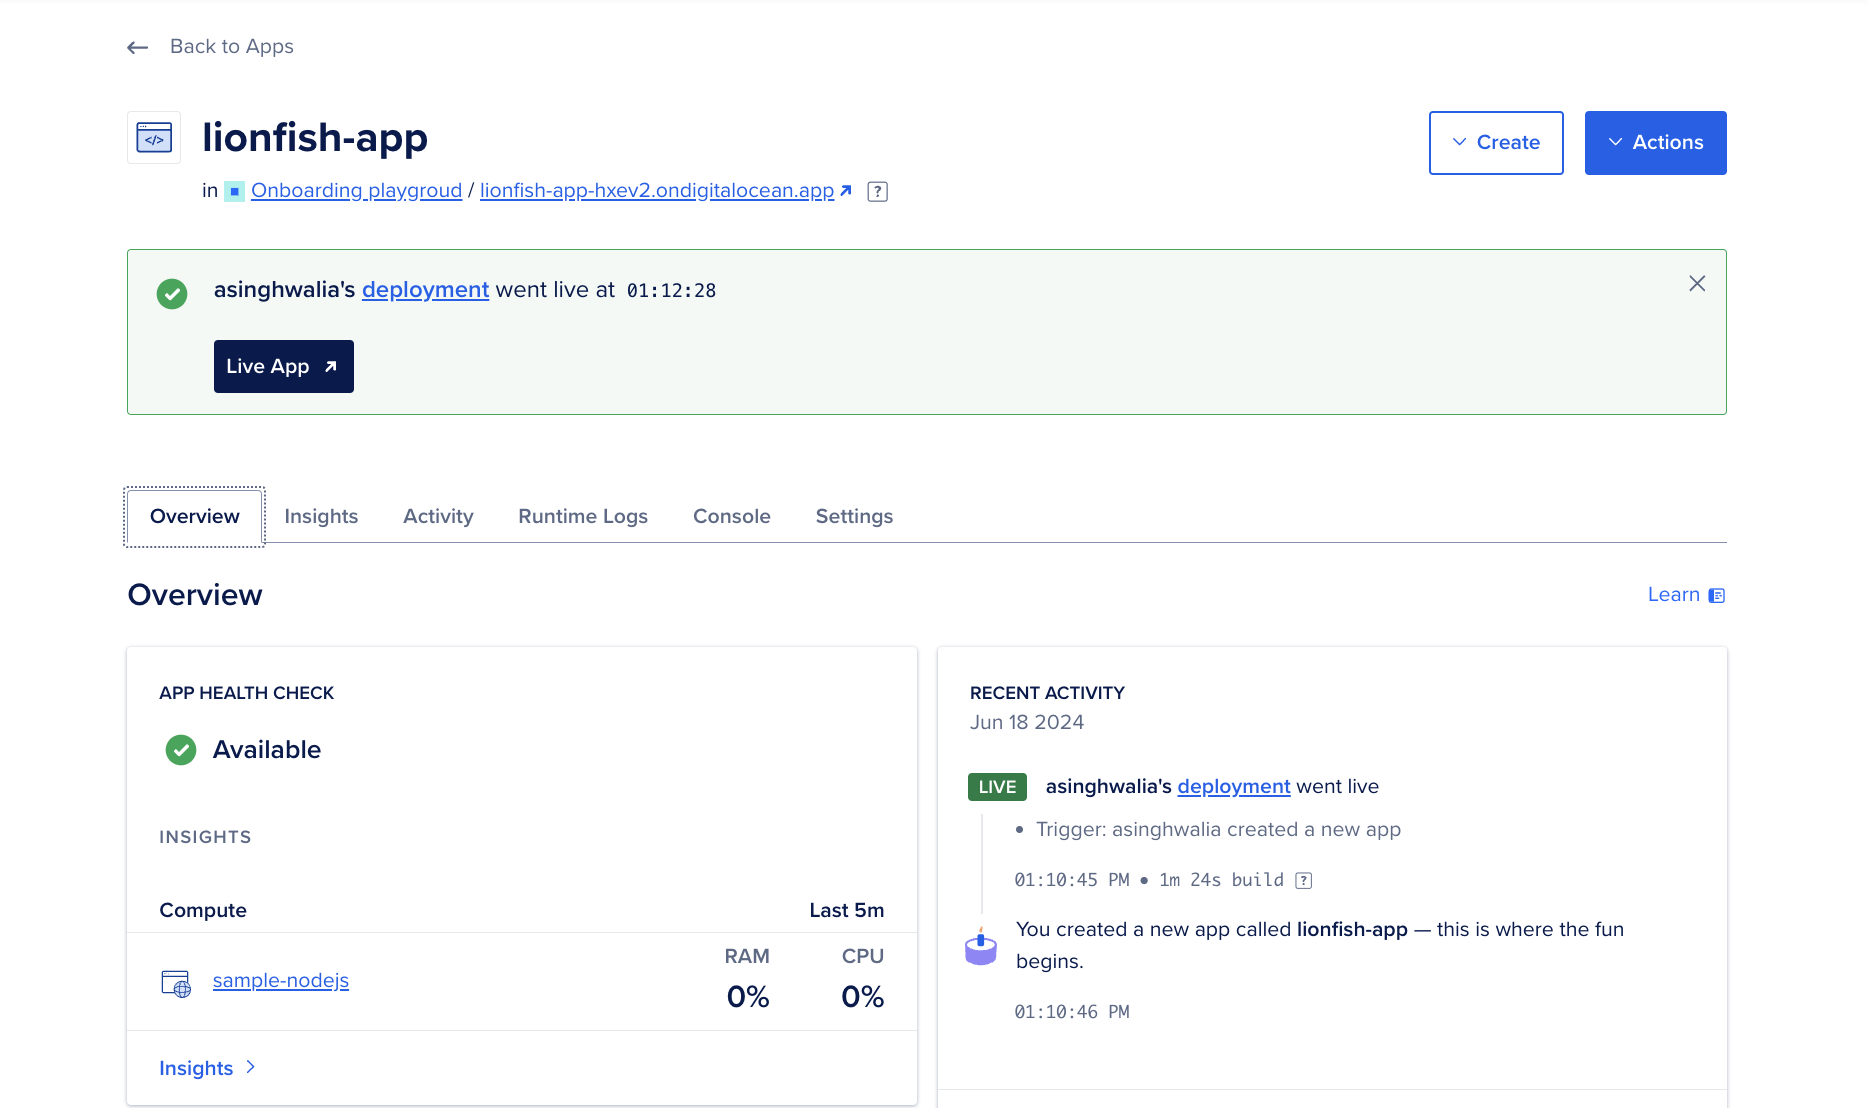
Once the application is deployed and built, you can check the application overview and visit the deployed application in your browser.
Step 3 – Connect the PostgreSQL database to the App Platform
In this step, you connect the managed PostgreSQL database created in Step 1 of this tutorial to the Node.js application sample created in Step-2.
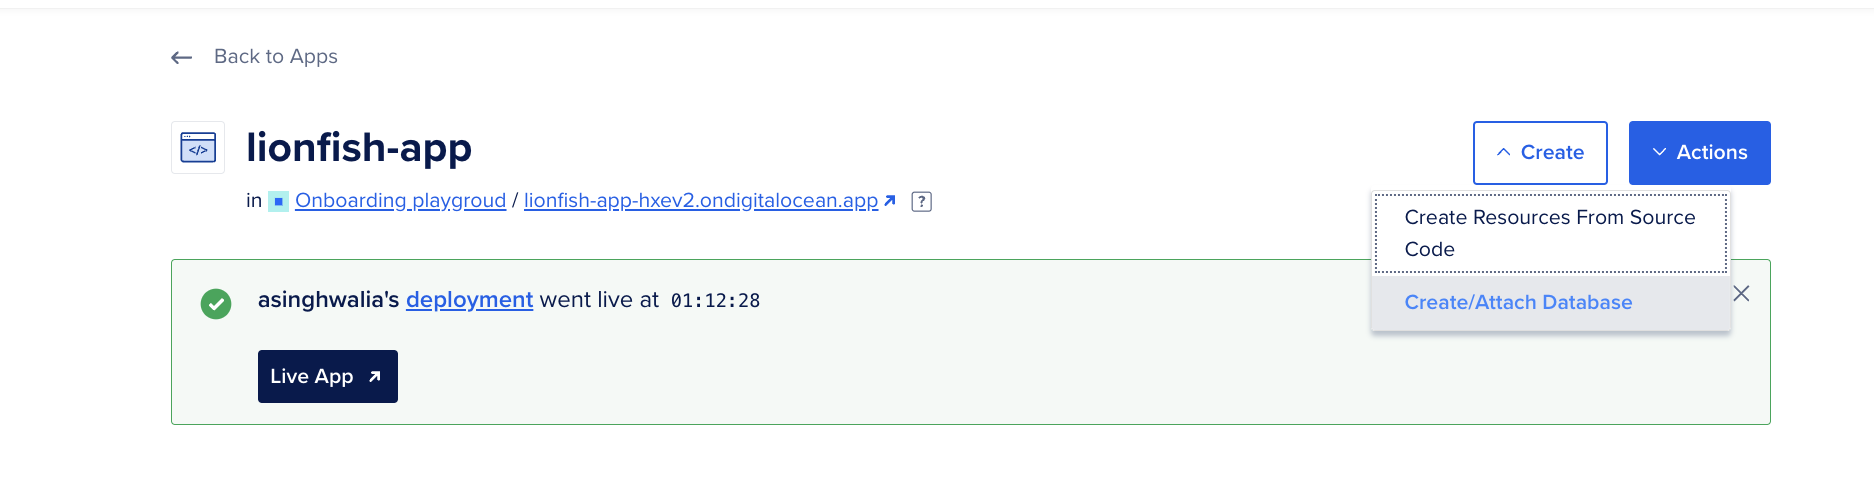
Go to your deployed app platform app, click the Create button on your deployed app dashboard, and click "Create/Attach Database":
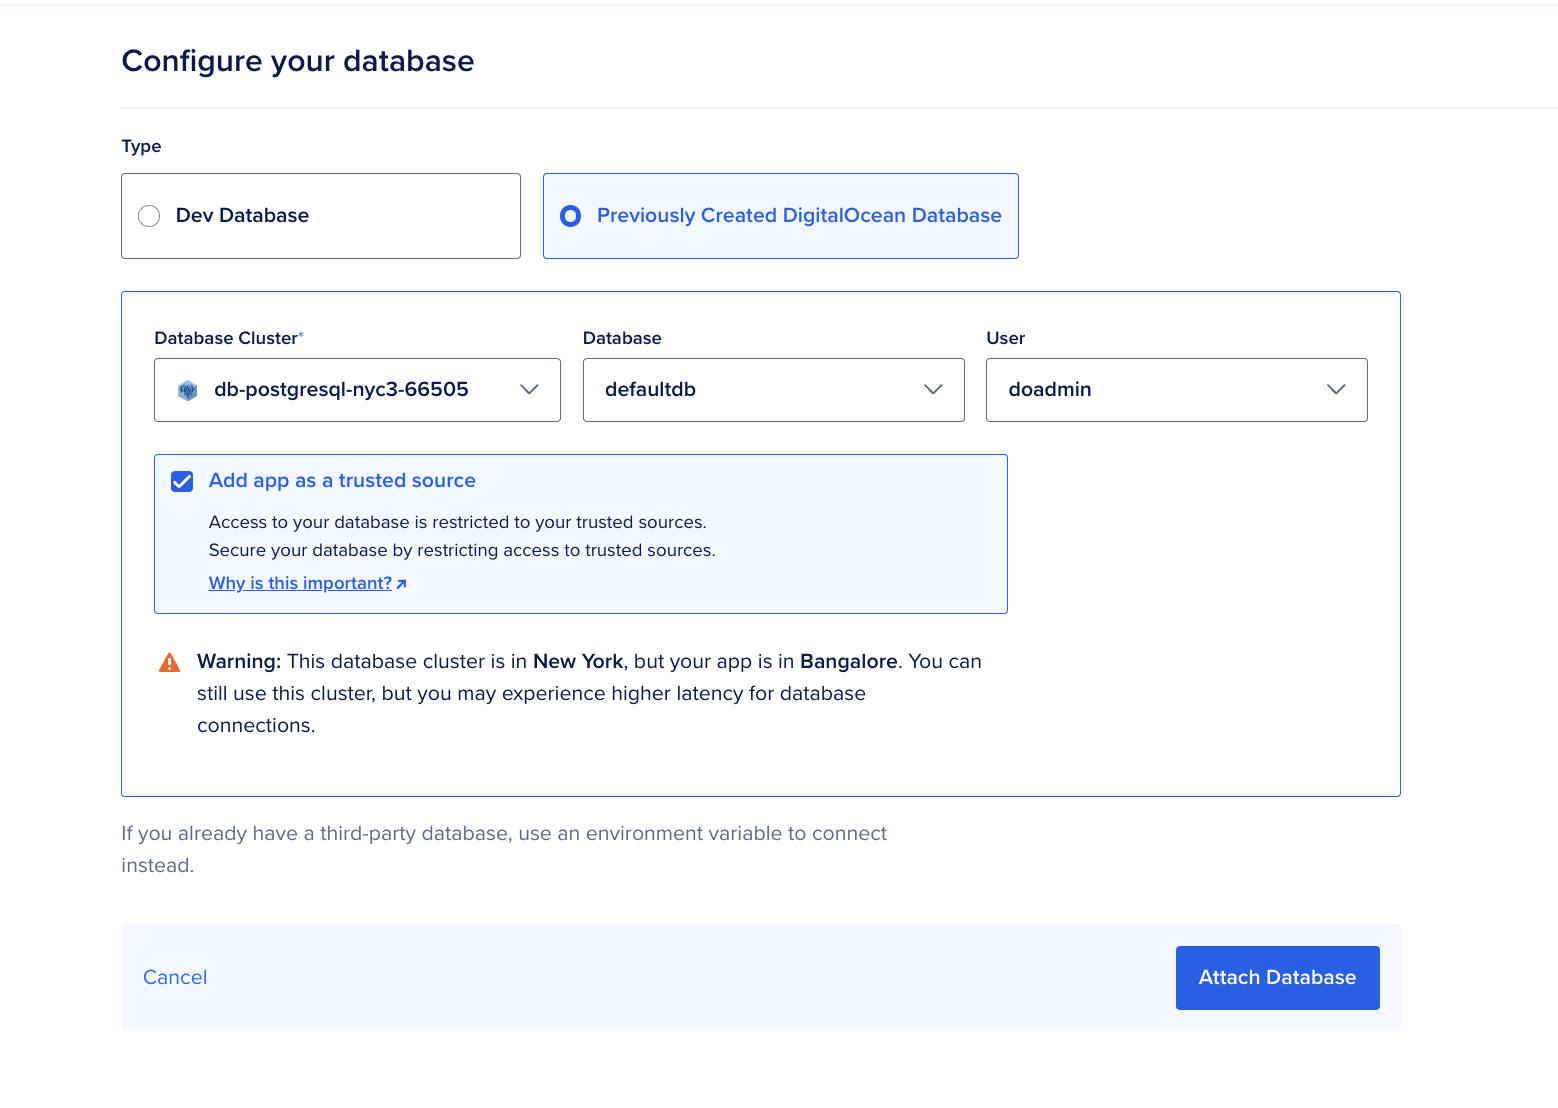
Then, select "Previously Created DigitalOcean Database" and select the recently deployed PostgreSQL managed database cluster and click the "Attach Database" button at the bottom.
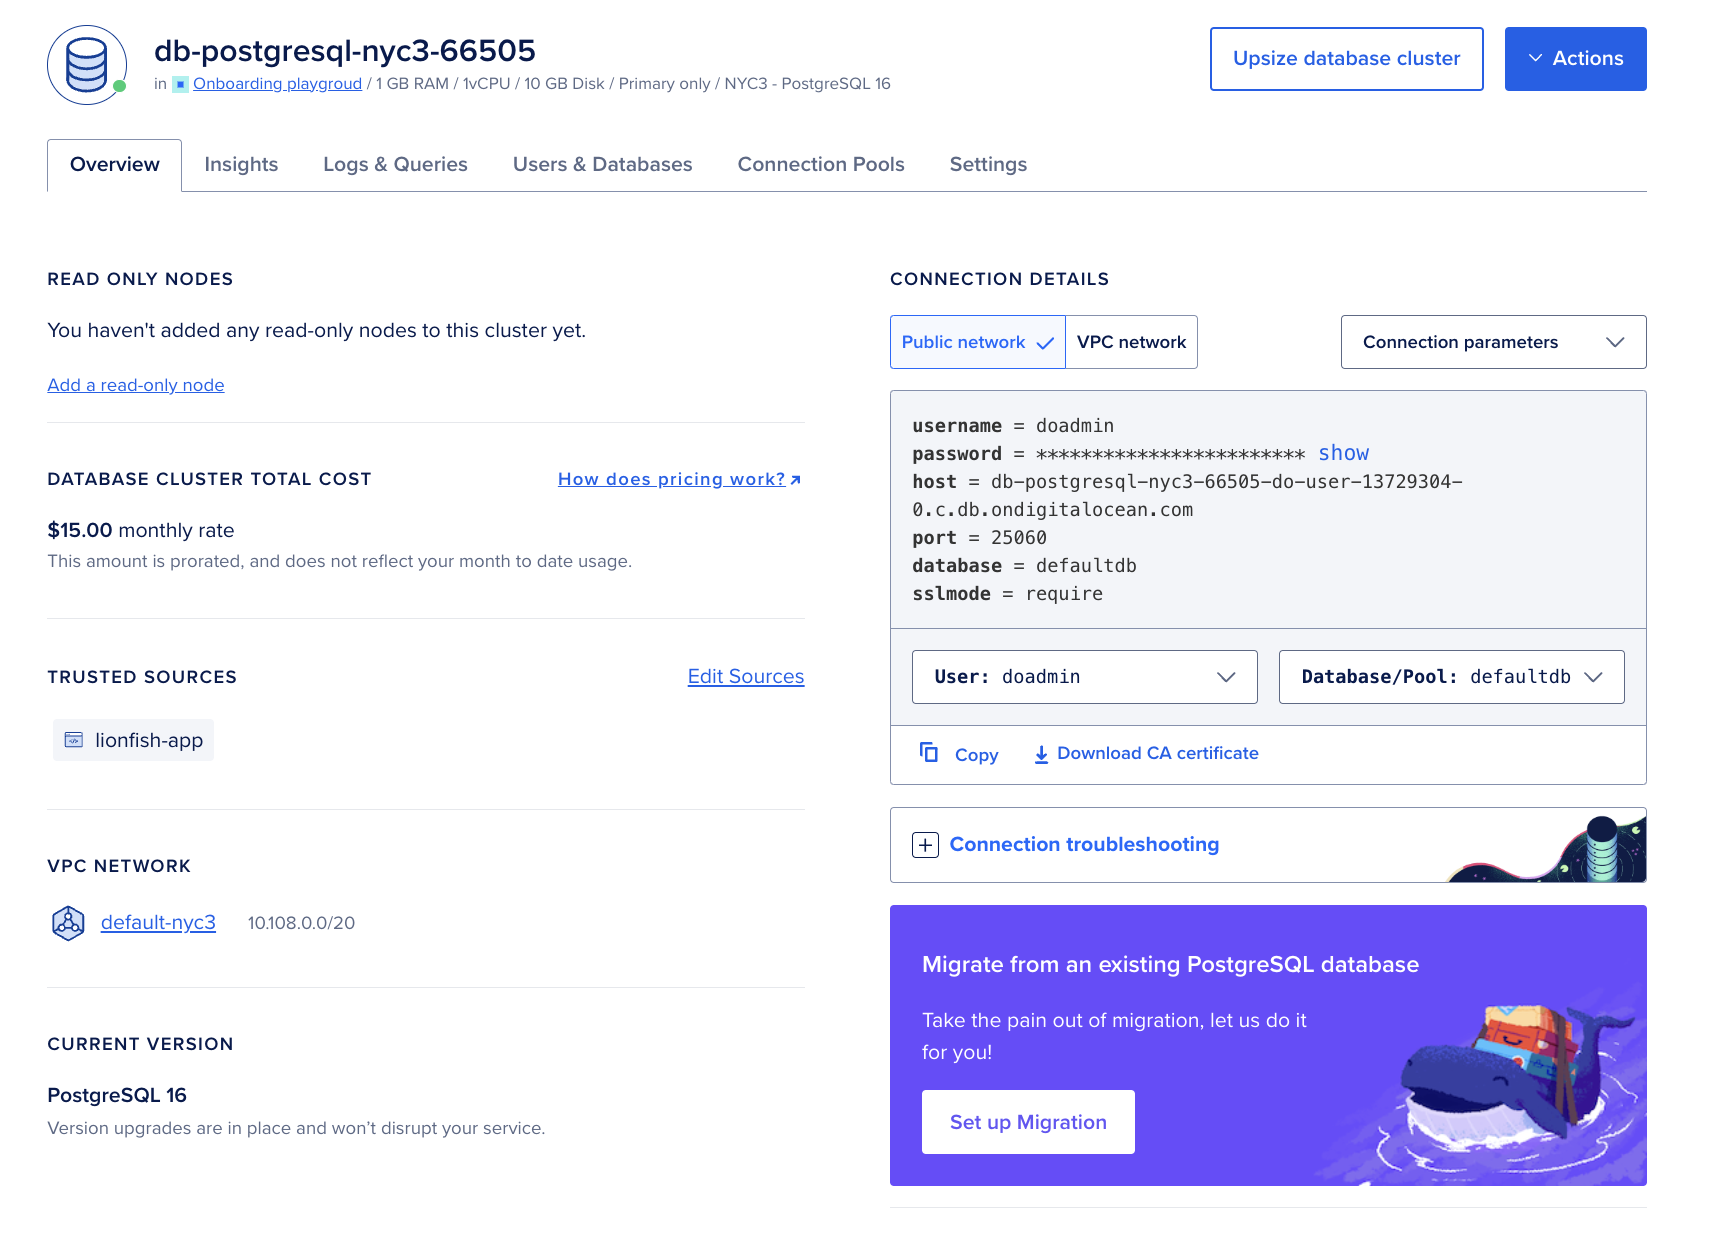
You can verify in the Database Overview section that the App Platform app has been successfully added as a trusted source.
Step 4 – Get Scrapable Metrics from the /metrics endpoint
You can programmatically view metrics for your database cluster through the /metrics endpoint. This endpoint includes over twenty times the metrics that you can access in the Insights tab in the control panel.
You can access the metric endpoint with the curl command or use Postman to visualize those metrics in a monitoring system like Prometheus.
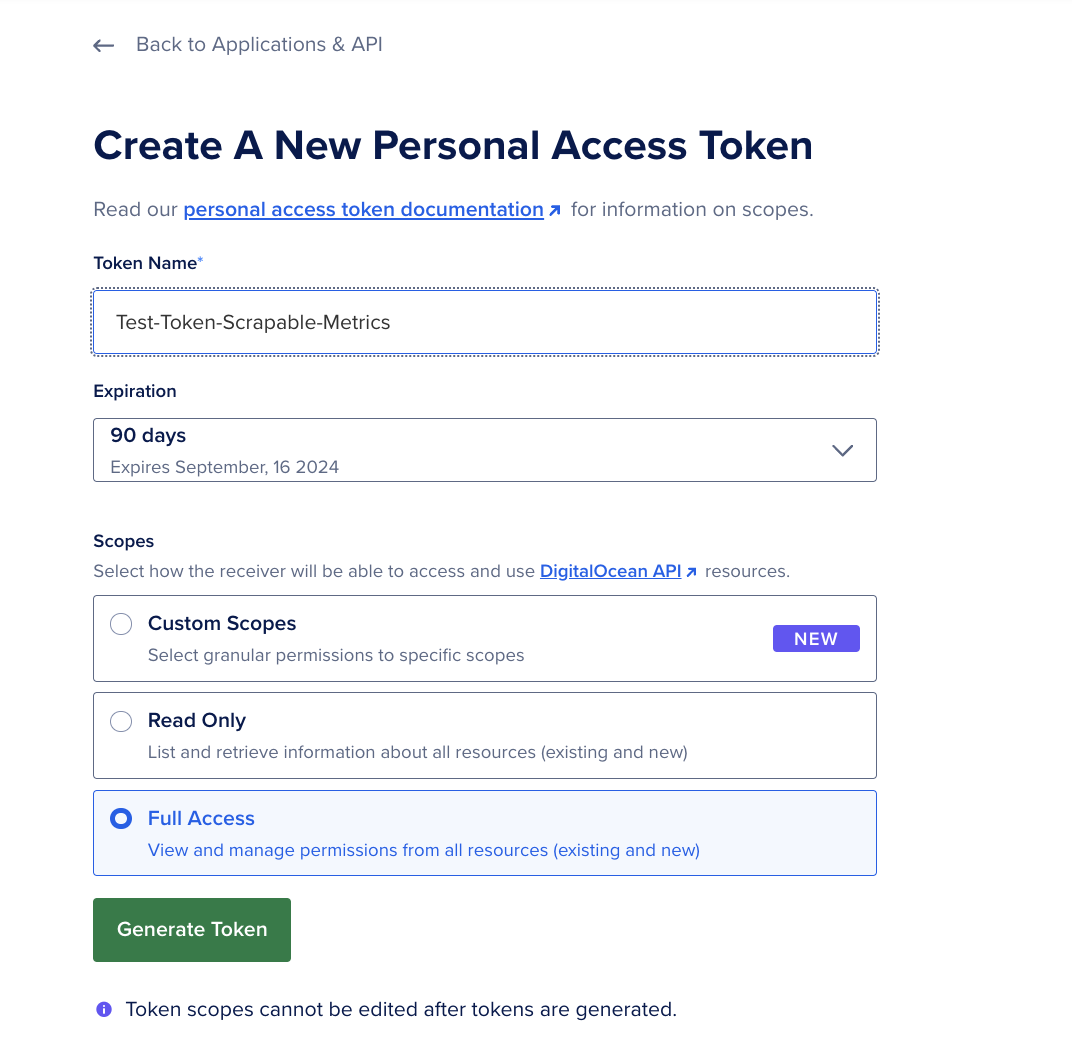
First of all, go to the API section in the DigitalOcean control panel and create a new personal access token and click on Generate Token with Full Access. Please take note of the access token as you will need it in the following steps.
In this example, you will use Postman to execute all HTTP requests. Or you can run curl commands from your App Platform instance to get responses to API requests.
Get the hostname and port.
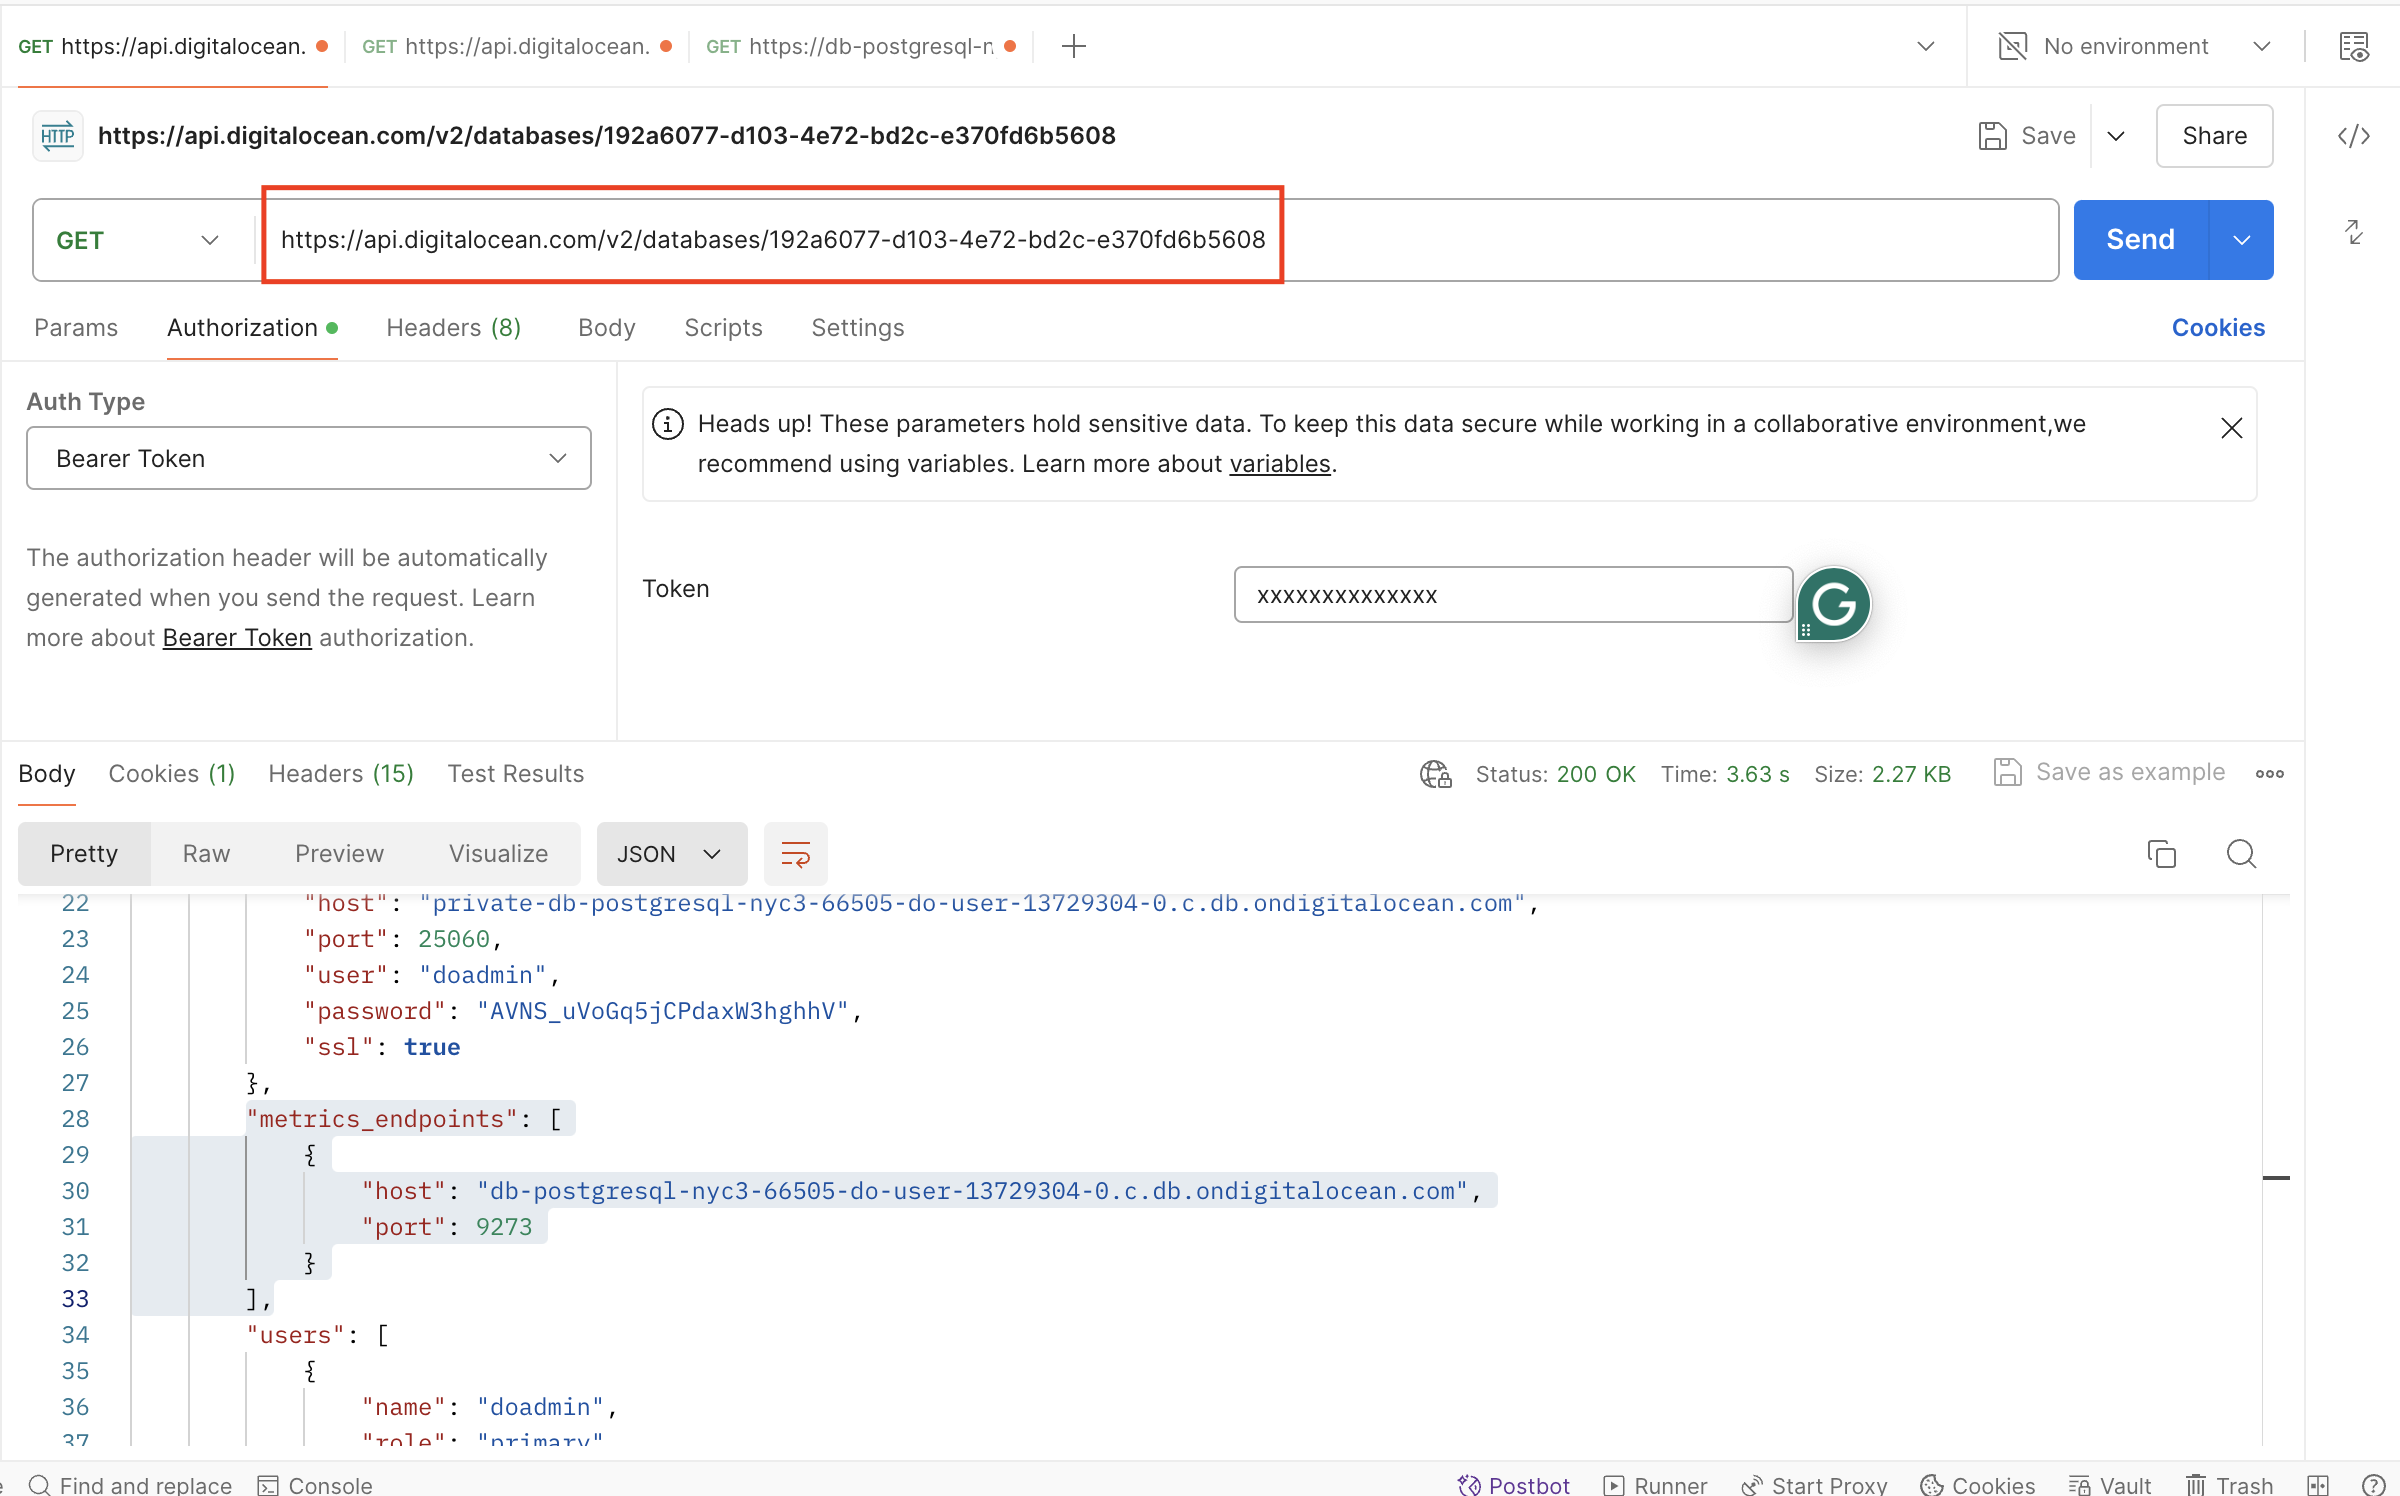
First, you need to retrieve the hostname of your cluster metrics by sending a GET request to https://api.digitalocean.com/v2/databases/{UUID}.
Run the following curl command from your App Platform instance. To do this, go to the console section:
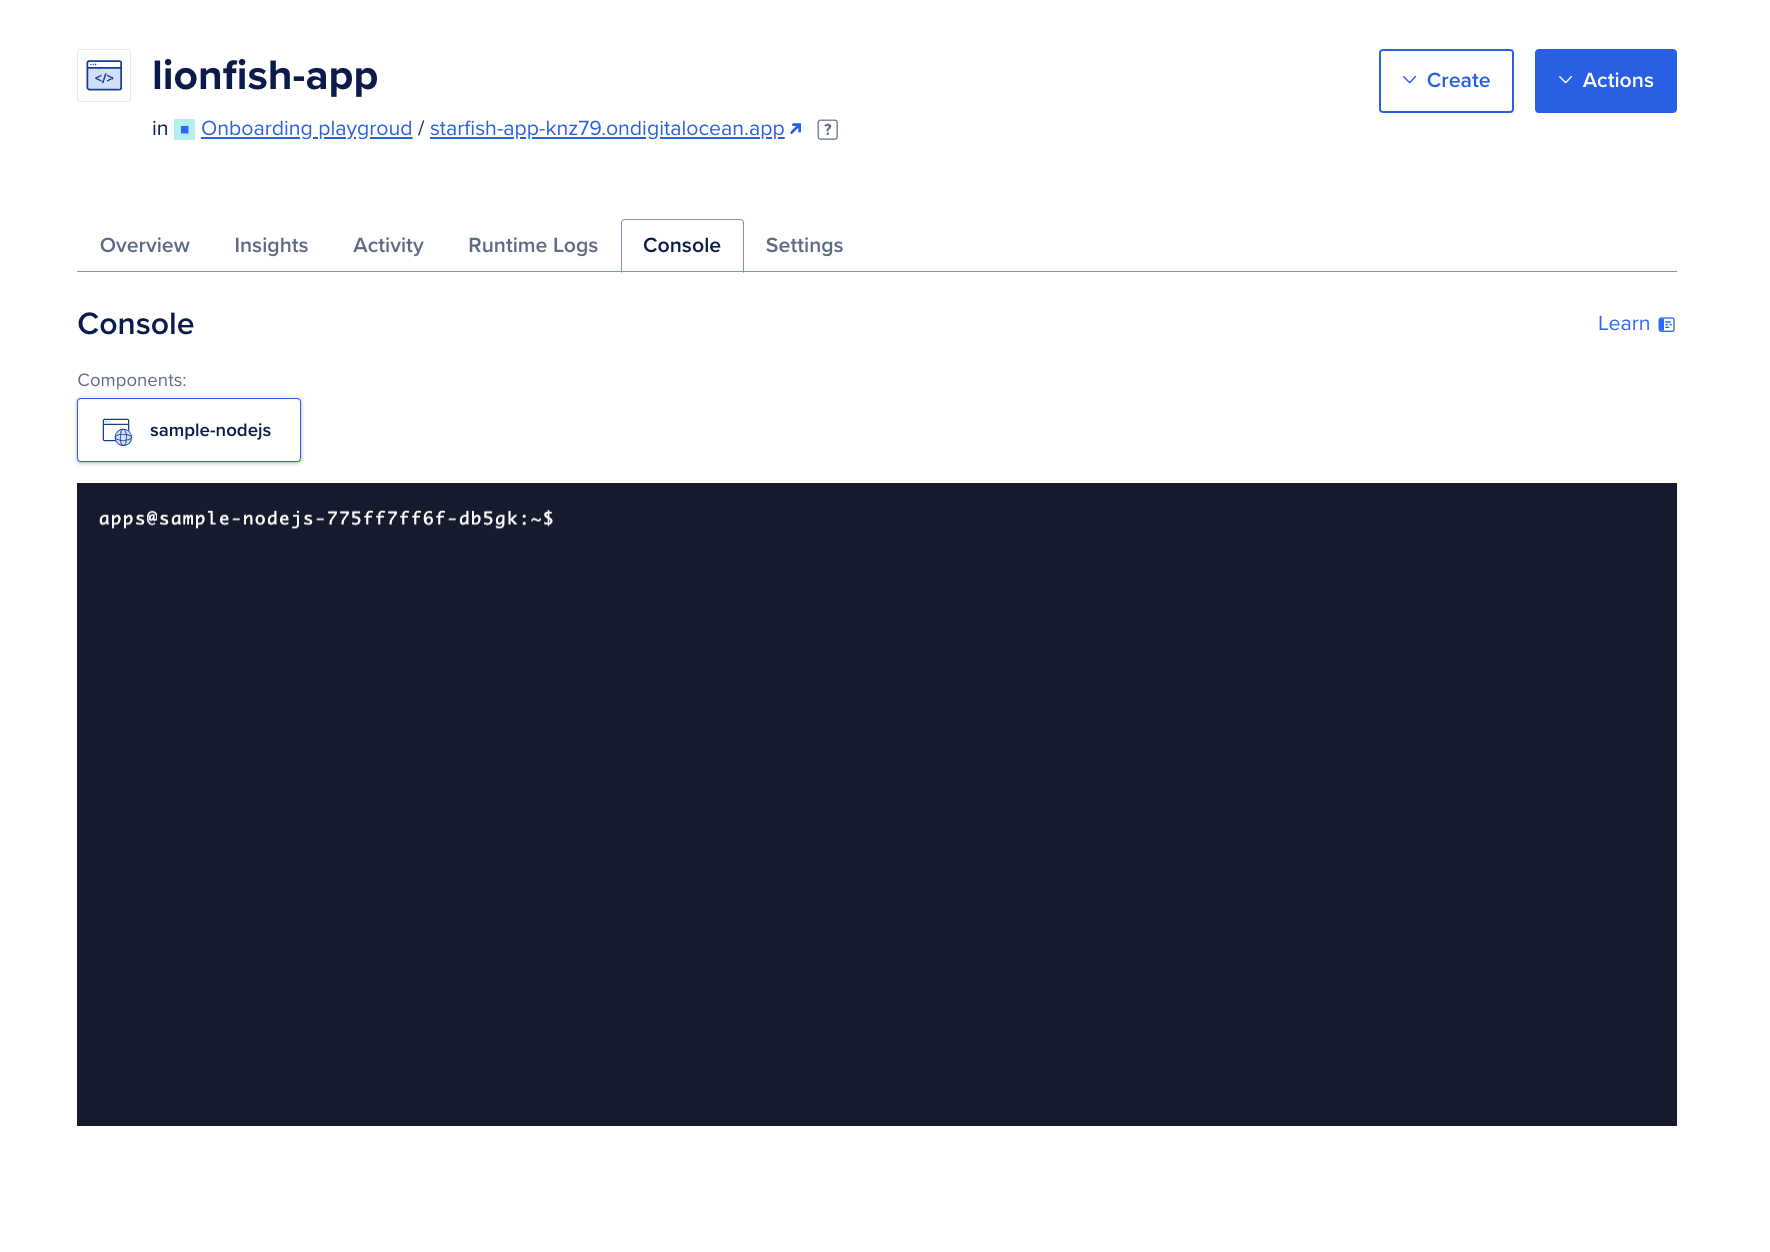
Use the following command to get the hostname and database credentials
apps@sample-nodejs-775ff7ff6f-db5gk:~$ curl --silent -XGET --location 'https://api.digitalocean.com/v2/databases/{UUID}' --header 'Content-Type: application/json' --header "Authorization: Bearer $RO_DIGITALOCEAN_TOKEN"Please replace {UUID} and $RO_DIGITALOCEAN_TOKEN with the UUID of your managed PostgreSQL database and your personal access password.
This command should give you an output with details of the managed PostgreSQL database cluster:
Output
"database": {
"id": "192a6077-d103-4e72-bd2c-e370fd6b5608",
"name": "db-postgresql-nyc3-66505",
"engine": "pg",
"version": "16",
"semantic_version": "16.3",
"connection": {
"protocol": "postgresql",
"uri": "postgresql://doadmin:AVNS_uVoGq5jCPdaxW3hghhV@db-postgresql-nyc3-66505-do-user-13729304-0.c.db.ondigitalocean.com:25060/defaultdb?sslmode=require",
"database": "defaultdb",
"host": "db-postgresql-nyc3-66505-do-user-13729304-0.c.db.ondigitalocean.com",
"port": 25060,
"user": "doadmin",
"password": "AVNS_uVoGq5jCPdaxW3hghhV",
"ssl": true
},
"private_connection": {
"protocol": "postgresql",
"uri": "postgresql://doadmin:AVNS_uVoGq5jCPdaxW3hghhV@private-db-postgresql-nyc3-66505-do-user-13729304-0.c.db.ondigitalocean.com:25060/defaultdb?sslmode=require",
"database": "defaultdb",
"host": "private-db-postgresql-nyc3-66505-do-user-13729304-0.c.db.ondigitalocean.com",
"port": 25060,
"user": "doadmin",
"password": "AVNS_uVoGq5jCPdaxW3hghhV",
"ssl": true
},
"metrics_endpoints": [
{
"host": "db-postgresql-nyc3-66505-do-user-13729304-0.c.db.ondigitalocean.com",
"port": 9273
}
],
"users": [
{
"name": "doadmin",
"role": "primary",
"password": "XXXXXXXXXXX"
}
],
"db_names": [
"defaultdb"
],
"num_nodes": 1,
"region": "nyc3",
"status": "online",
"created_at": "2024-06-10T21:04:32Z",
"maintenance_window": {
"day": "monday",
"hour": "00:07:46",
"pending": false
},
"size": "db-s-1vcpu-1gb",
"tags": [
"testtestnn"
],
"private_network_uuid": "xxxxxxxxxx",
"project_id": "xxxxxxxxxxx",
"read_only": false,
"version_end_of_life": "2028-11-09T00:00:00Z",
"version_end_of_availability": "2028-05-09T00:00:00Z",
"storage_size_mib": 10240
}
}
In the output above, please note the host/port pair. In our case, the host is db-postgresql-nyc3-66505-do-user-13729304-0.c.db.ondigitalocean.com and the port is 9273.
Also, if you have installed Postman on your system and added your system's IP address as a trusted source in the database's trusted source settings, you can run the above HTTP GET request in Postman.
Simply add the URL https://api.digitalocean.com/v2/databases/{UUID} and replace your personal access code under the authorization tab with the verification type selected as the bearer token.
Get cluster metrics validation
Next, you need your cluster metrics credentials. You can retrieve these by making a GET request to https://api.digitalocean.com/v2/databases/metrics/credentials with an admin or write token.
Use the following curl command from the App Platform sample application:
apps@sample-nodejs-775ff7ff6f-db5gk:~$ curl --silent -XGET --location 'https://api.digitalocean.com/v2/databases/metrics/credentials' --header 'Content-Type: application/json' --header "Authorization: Bearer xxxxxxxxxxxxxxxxx"It should give you cluster metrics credentials with a username and password.
Output{
"credentials": {
"basic_auth_username": "prom2prh",
"basic_auth_password": "xxxxxxxxxxxxx"
}
}
Access the /metrics endpoint
To access the endpoint using cURL, send a GET request to https://$HOST:9273/metrics and replace the hostname, username, and password variables with the credentials you found in the previous steps:
apps@sample-nodejs-775ff7ff6f-db5gk:~$ curl -XGET -k -u $USERNAME:$PASSWORD https://$HOST:9273/metricsIt should give you a lot of metadata like the following:
Output...
1",project="do-user-13729304-0",service="db-postgresql-nyc3-66505",service_type="pg"} 0.7
# HELP system_n_cpus Telegraf collected metric
# TYPE system_n_cpus gauge
system_n_cpus{cloud="custom-digitalocean-do-nyc3",host="db-postgresql-nyc3-66505-1",project="do-user-13729304-0",service="db-postgresql-nyc3-66505",service_type="pg"} 1
# HELP system_n_unique_users Telegraf collected metric
# TYPE system_n_unique_users gauge
system_n_unique_users{cloud="custom-digitalocean-do-nyc3",host="db-postgresql-nyc3-66505-1",project="do-user-13729304-0",service="db-postgresql-nyc3-66505",service_type="pg"} 0
# HELP system_n_users Telegraf collected metric
# TYPE system_n_users gauge
system_n_users{cloud="custom-digitalocean-do-nyc3",host="db-postgresql-nyc3-66505-1",project="do-user-13729304-0",service="db-postgresql-nyc3-66505",service_type="pg"} 0
# HELP system_uptime Telegraf collected metric
# TYPE system_uptime counter
system_uptime{cloud="custom-digitalocean-do-nyc3",host="db-postgresql-nyc3-66505-1",project="do-user-13729304-0",service="db-postgresql-nyc3-66505",service_type="pg"} 640073
...
Step 5 – Visualize metrics with Prometheus
To access the endpoint using Prometheus, copy the following configuration into a prometheus.yml file, replacing the hostname, username, password, and CA certificate path. This configures Prometheus to use all the necessary credentials to access the endpoint:
# prometheus.yml
global:
scrape_interval: 15s
evaluation_interval: 15s
scrape_configs:
- job_name: 'dbaas_cluster_metrics_svc_discovery'
scheme: https
tls_config:
ca_file: /path/to/ca.crt
dns_sd_configs:
- names:
- $TARGET_ADDRESS
type: 'A'
port: 9273
refresh_interval: 15s
metrics_path: '/metrics'
basic_auth:
username: $BASIC_AUTH_USERNAME
password: $BASIC_AUTH_PASSWORD
Please replace $TARGET_ADDRESS, $BASIC_AUTH_USERNAME, and $BASIC_AUTH_PASSWORD with the hostname, username, and password obtained in the steps above.
Then copy the following connection script into a file called up.sh. This script will run envsubst and start a Prometheus container with the configuration from the previous step.
#!/bin/bash
envsubst < prometheus.yml > /tmp/dbaas-prometheus.yml
docker run -p 9090:9090 \
-v /tmp/dbaas-prometheus.yml:/etc/prometheus/prometheus.yml \
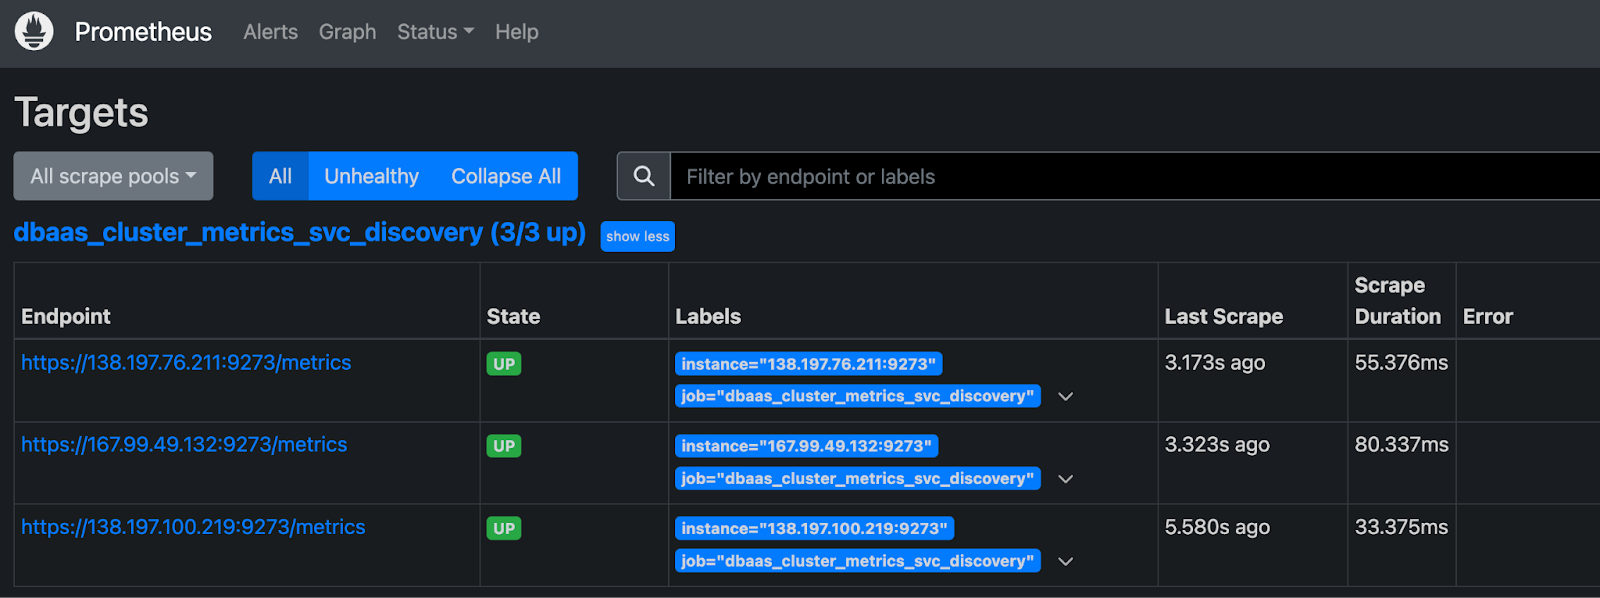
prom/prometheusGo to http://localhost:9090/targets in your browser to verify that multiple hosts are up and running.
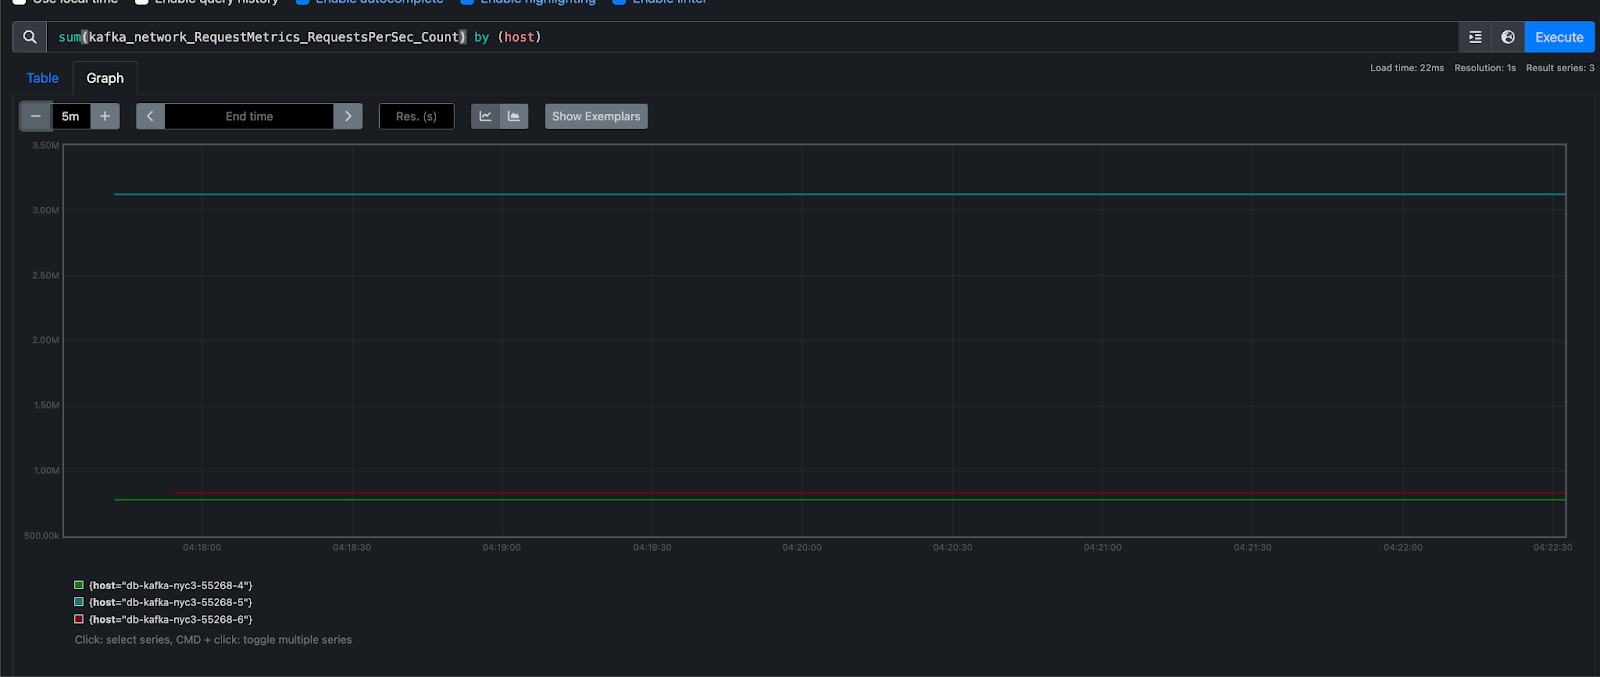
Then, go to http://localhost:9090/graph to query the database metrics from Prometheus.
For more details, see the Prometheus DNS SD documentation and TLS configuration documentation.
To learn and understand each of the metrics, you can check out this official PostgreSQL Monitoring Statistics document.
You can also learn more about how to collect scrapable metrics for a managed PostgreSQL database.
Result
This tutorial will teach you how to set up and scrape metrics from a managed PostgreSQL database on DigitalOcean using a Node.js web application deployed on the DigitalOcean application platform and Prometheus. By enabling scrapable metrics, you can easily monitor the performance and health of your databases, ensuring optimal performance and in-depth troubleshooting to fix any issues.