
Introduction
Monitoring your DigitalOcean managed databases is essential to ensure their performance, stability, and security. By implementing monitoring solutions like Prometheus and Grafana, you gain valuable insights into the health and performance metrics of your database clusters, enabling proactive management and troubleshooting. You can programmatically access your database cluster metrics through the metrics endpoint, giving you access to over twenty times more metrics than what is available in the Insights tab of the cloud control panel.
This tutorial walks you through the steps to set up monitoring of DigitalOcean managed databases (except MongoDB) using Prometheus and Grafana. Here, we'll use a script that uses the scrapable metrics endpoint to export reports, allowing for comprehensive monitoring of your DigitalOcean managed databases. We'll cover accessing the metrics endpoint, configuring Prometheus to scrape metrics, and visualizing the data in Grafana.
Prerequisites
- A DigitalOcean account with managed databases (except MongoDB).
- Basic understanding of bash programming.
- The Prometheus droplet is deployed from the DigitalOcean Marketplace.
- A Grafana droplet deployed from the DigitalOcean Marketplace
- Installed dependencies: jq
- A personal access token created with database read access.
Preparation of Prometheus Drops
Step 1: SSH into the Prometheus droplet.
Step 2: Download the scrape.sh script using the wget command:
wget https://solutions-files.ams3.cdn.digitaloceanspaces.com/DBaaS-Scrape-Metrics/scrape.sh
Step 3: After downloading the script, make sure it has executable permissions by running the following:
chmod +x scrape.sh
Step 4: Run the scrape.sh script by running:
./scrape.sh
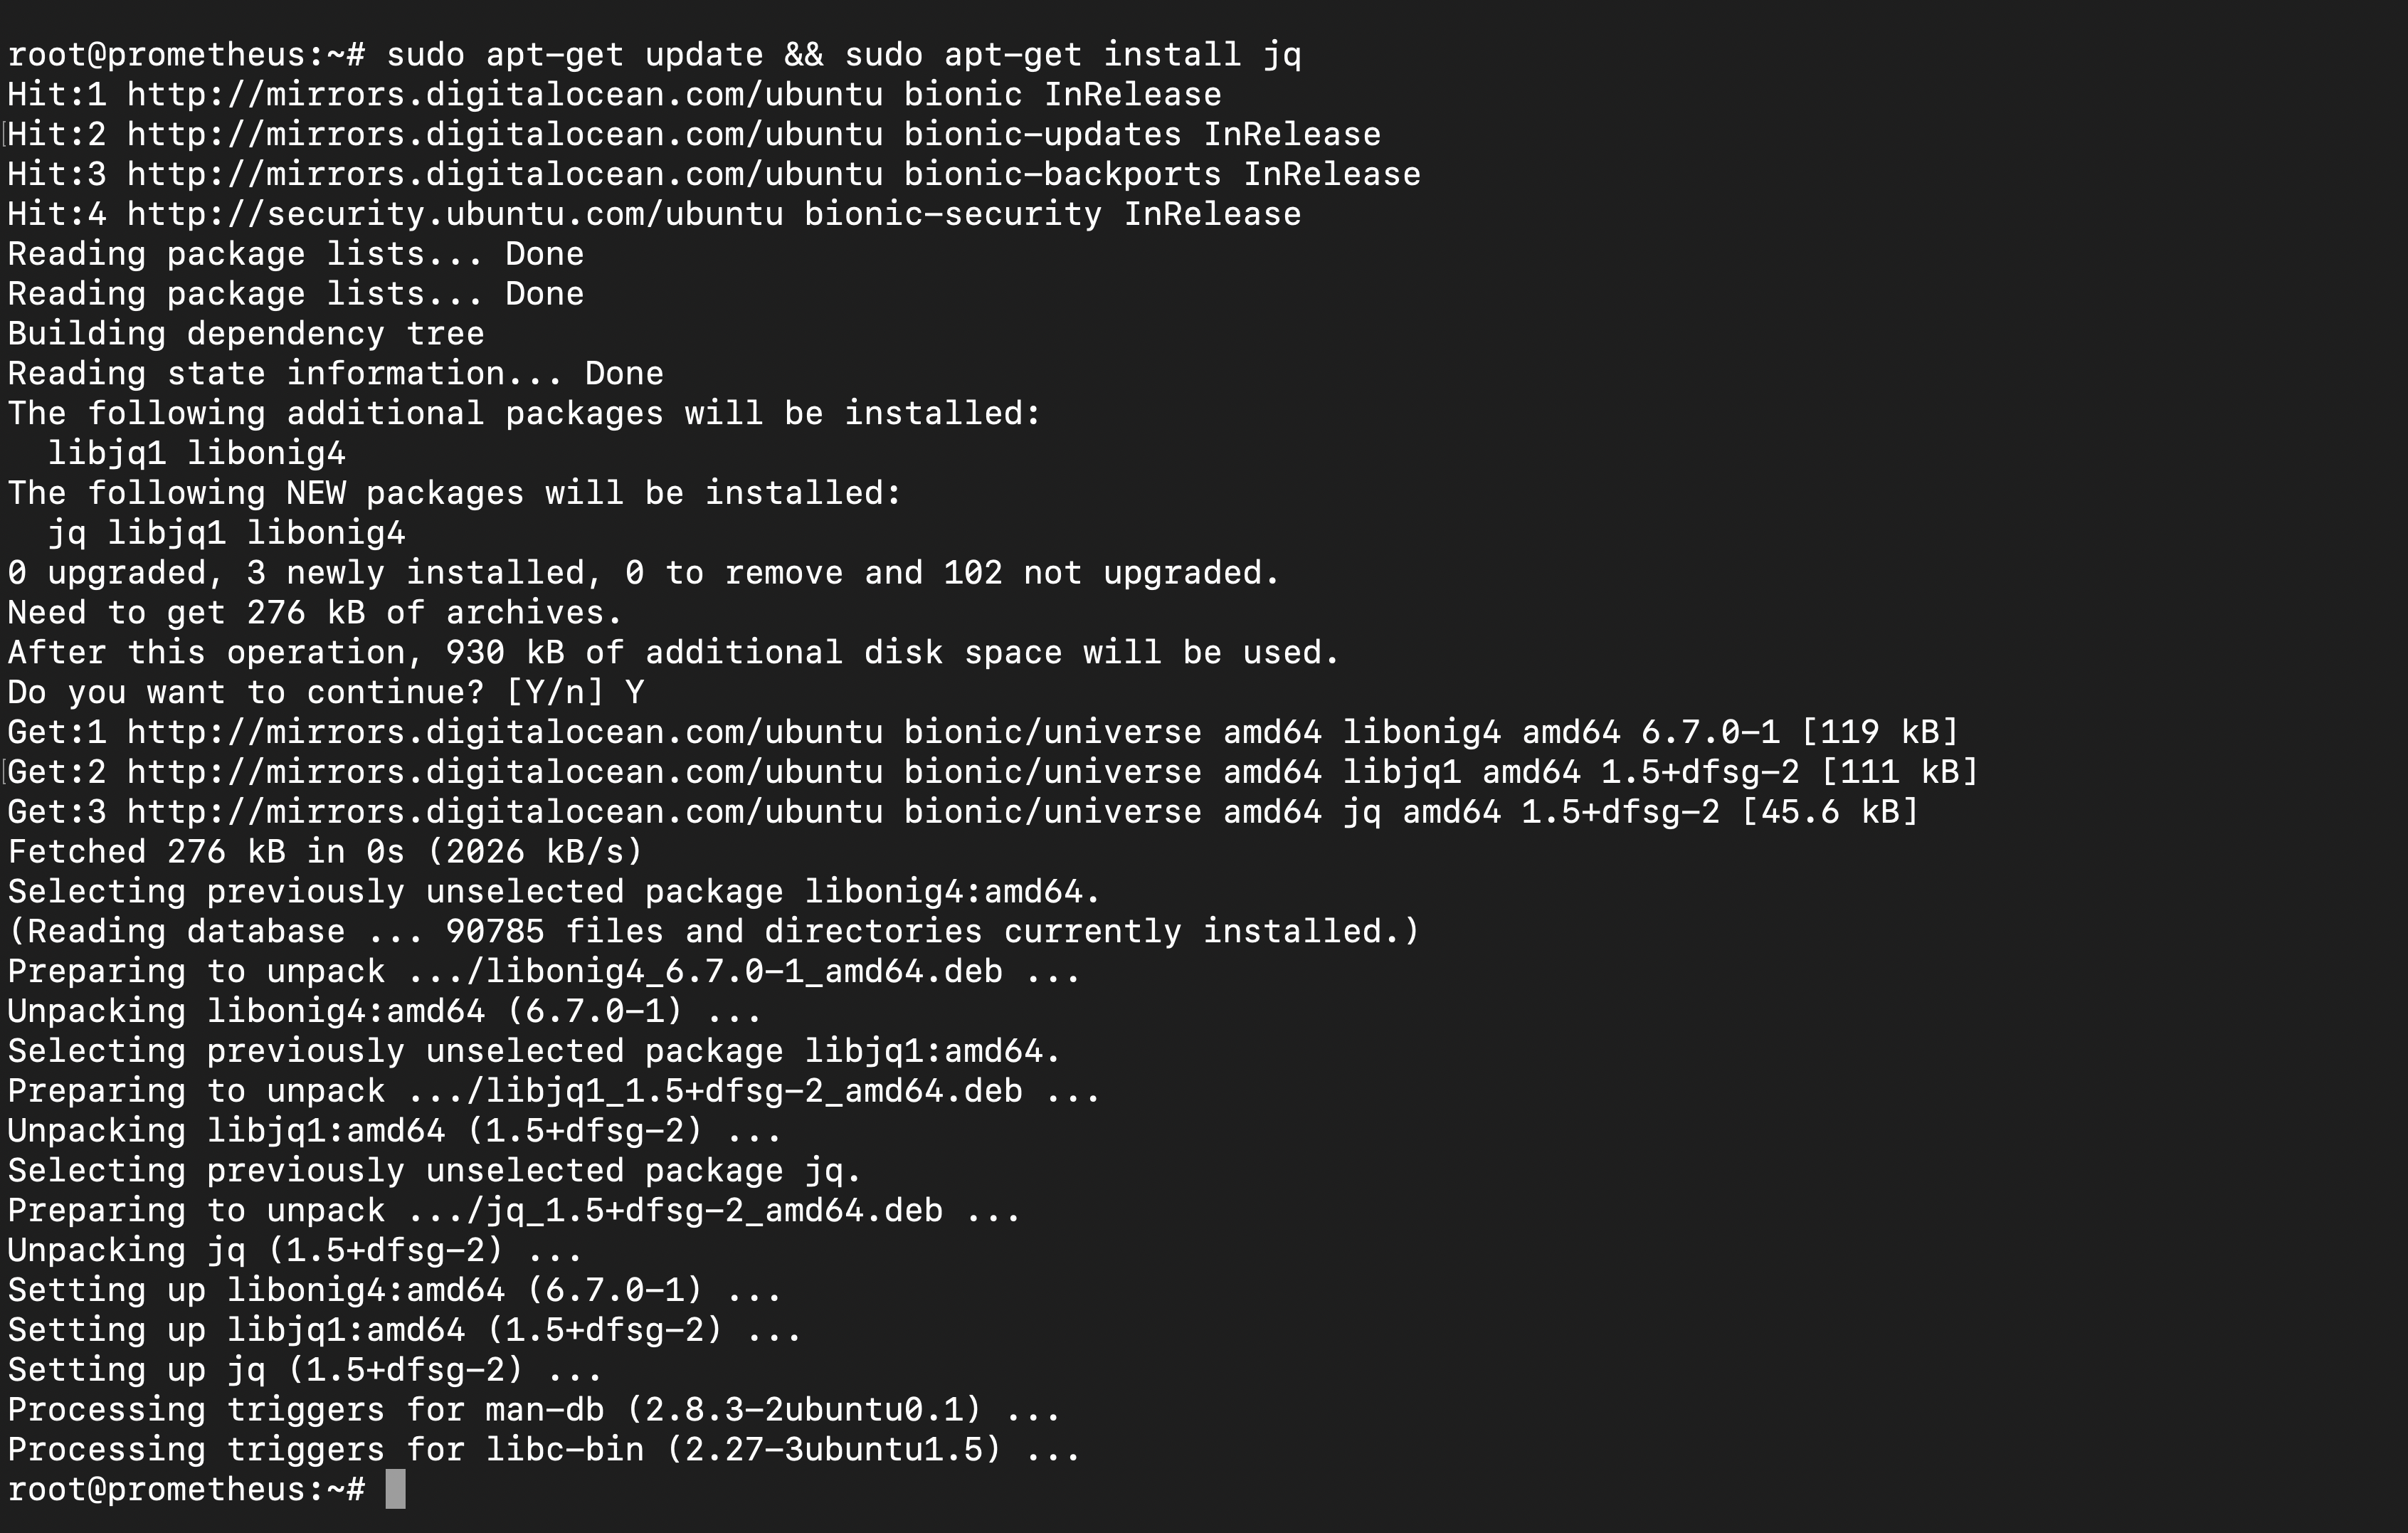
Note: If jq is not installed on the Droplet, you will encounter this error:
root@prometheus:~# ./scrape.sh
Checking dependencies...
Error: jq is not installed. Please install it before running this script.
In this case, you can install jq on the Droplet by running the following commands:
sudo apt-get update && sudo apt-get install jq
 If you encounter the following error while installing jq, remove the lock file by running the command sudo rm /var/lib/dpkg/lock*.
root@prometheus:~# sudo apt-get install jq
E: Could not get lock /var/lib/dpkg/lock-frontend - open (11: Resource temporarily unavailable)
E: Unable to acquire the dpkg frontend lock (/var/lib/dpkg/lock-frontend), is another process using it?
root@prometheus:~# sudo dpkg --configure -a
dpkg: error: dpkg frontend is locked by another process
root@prometheus:~# sudo rm /var/lib/dpkg/lock*
root@prometheus:~# sudo apt-get install jq
Reading package lists... Done
Building dependency tree
Reading state information... Done
After installing jq, run the script again.
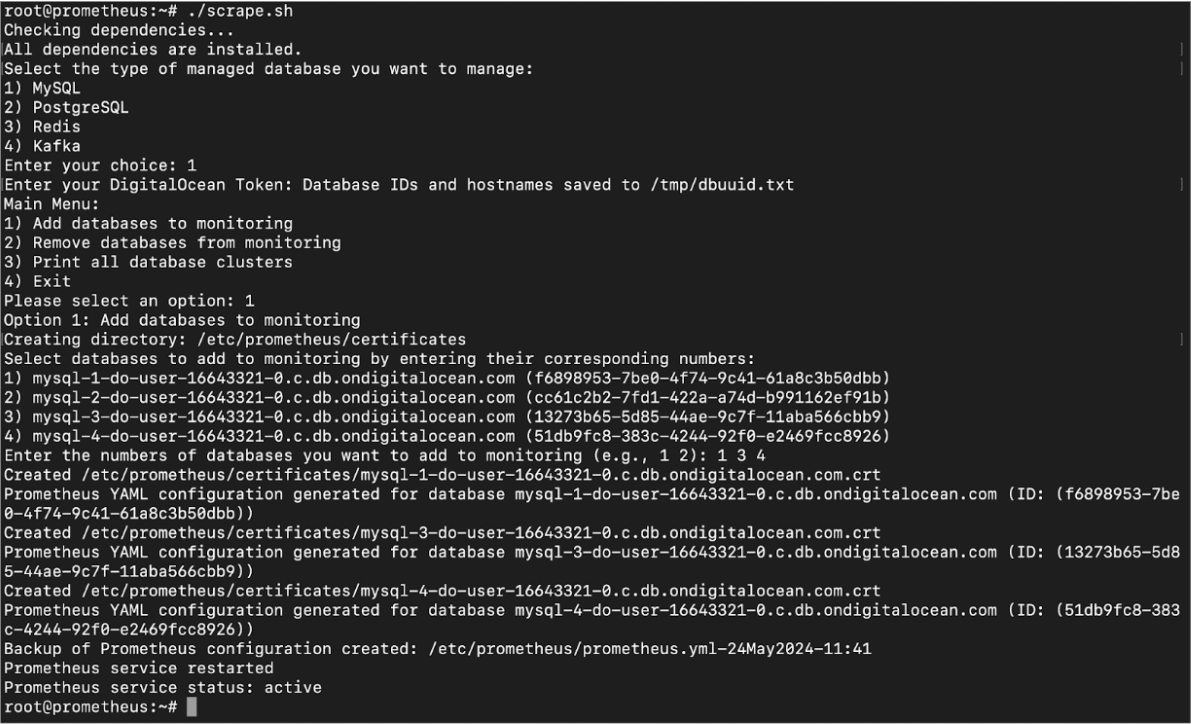
Step 5: Select the managed database you want to manage by entering its number.
Step 6: Enter your DigitalOcean password.
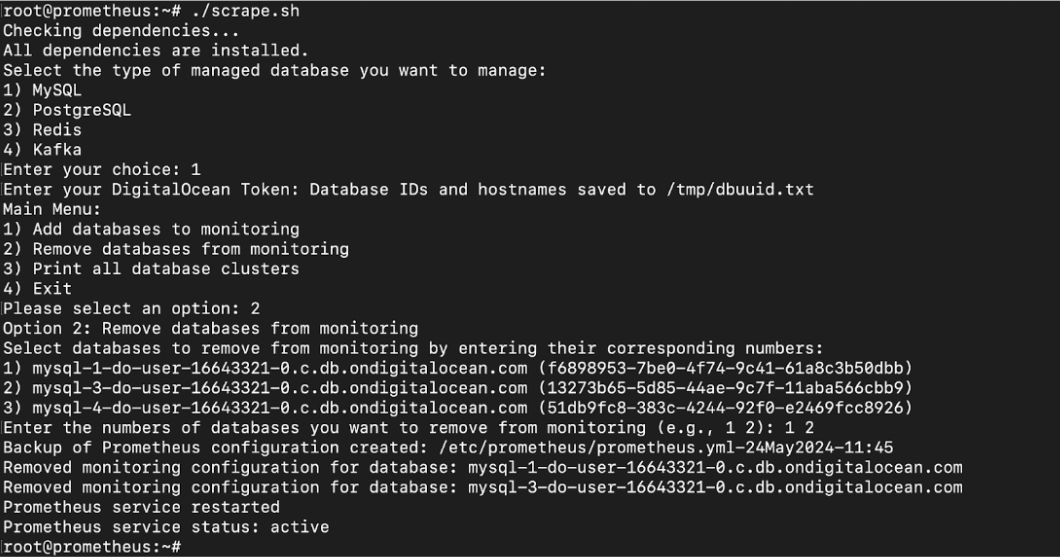
Step 7: In the main menu, select the required option and select the database.
Step 8: The script adds or removes databases for monitoring.
Step 9: After adding or removing, check if the targets on prometheus_hostname:9090 are updated.
Adding databases to monitoring
Removing databases from monitoring
Preparing Grafana Droplet
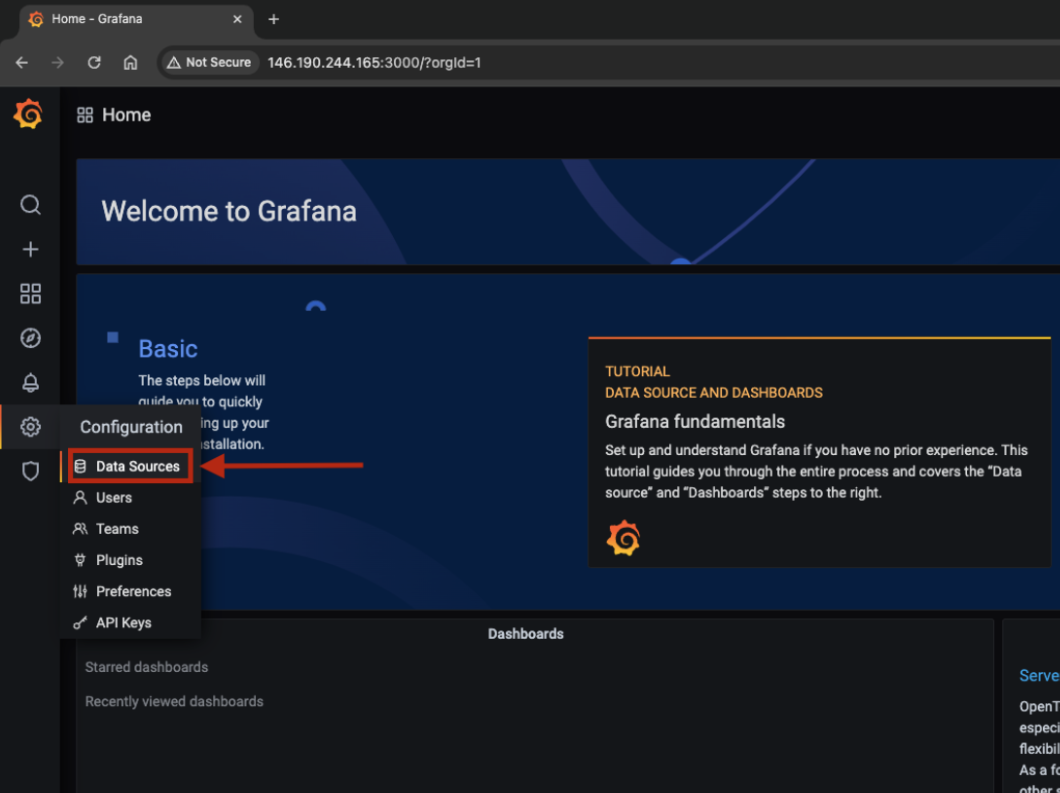
Step 1: Log in to the Grafana dashboard by visiting the URL Grafana_IP:3000 in your browser.
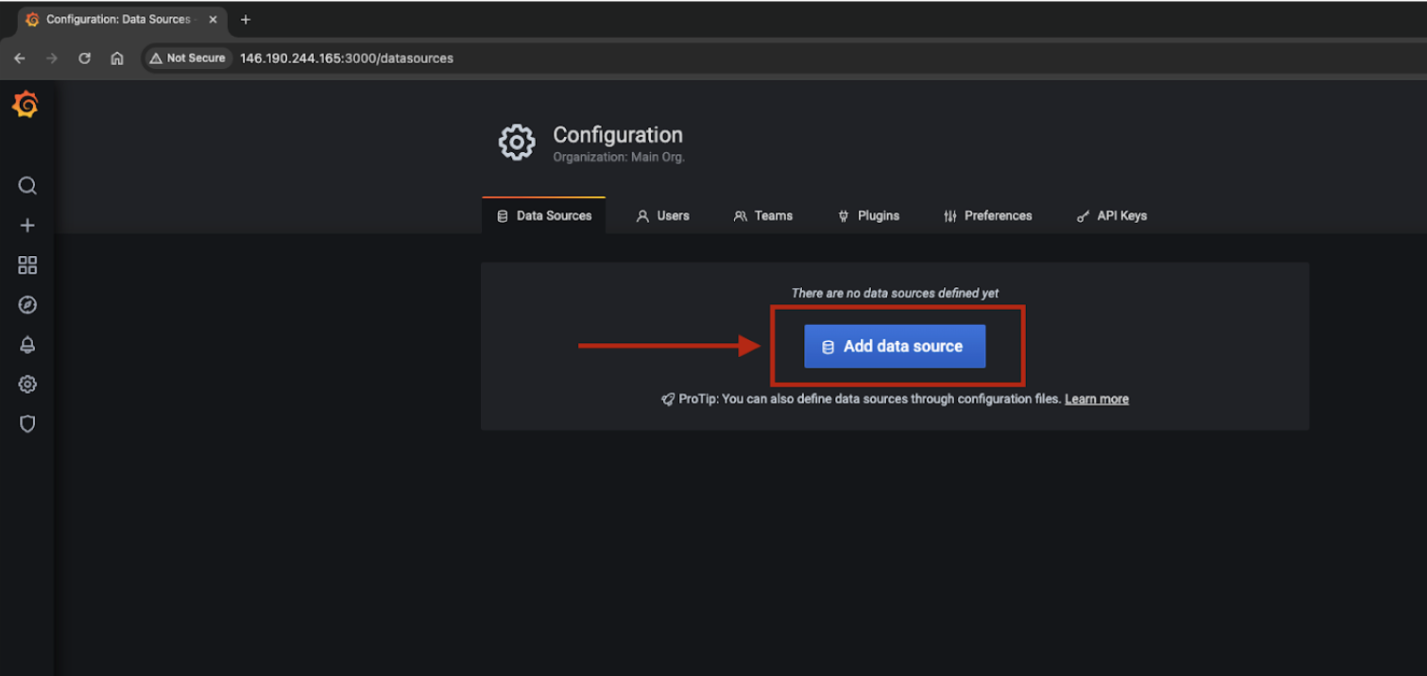
Step 2: Go to Configuration > Data Sources.
Step 3: Click Add Data Source.
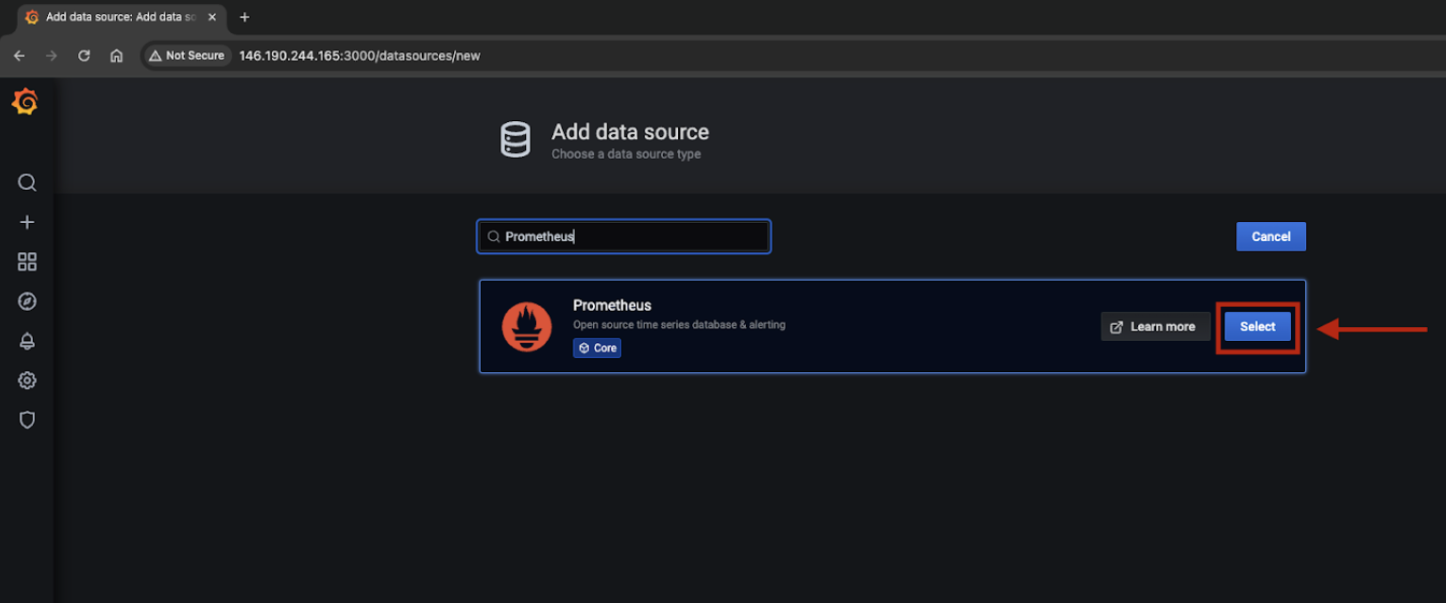
Step 4: Search and select Prometheus.
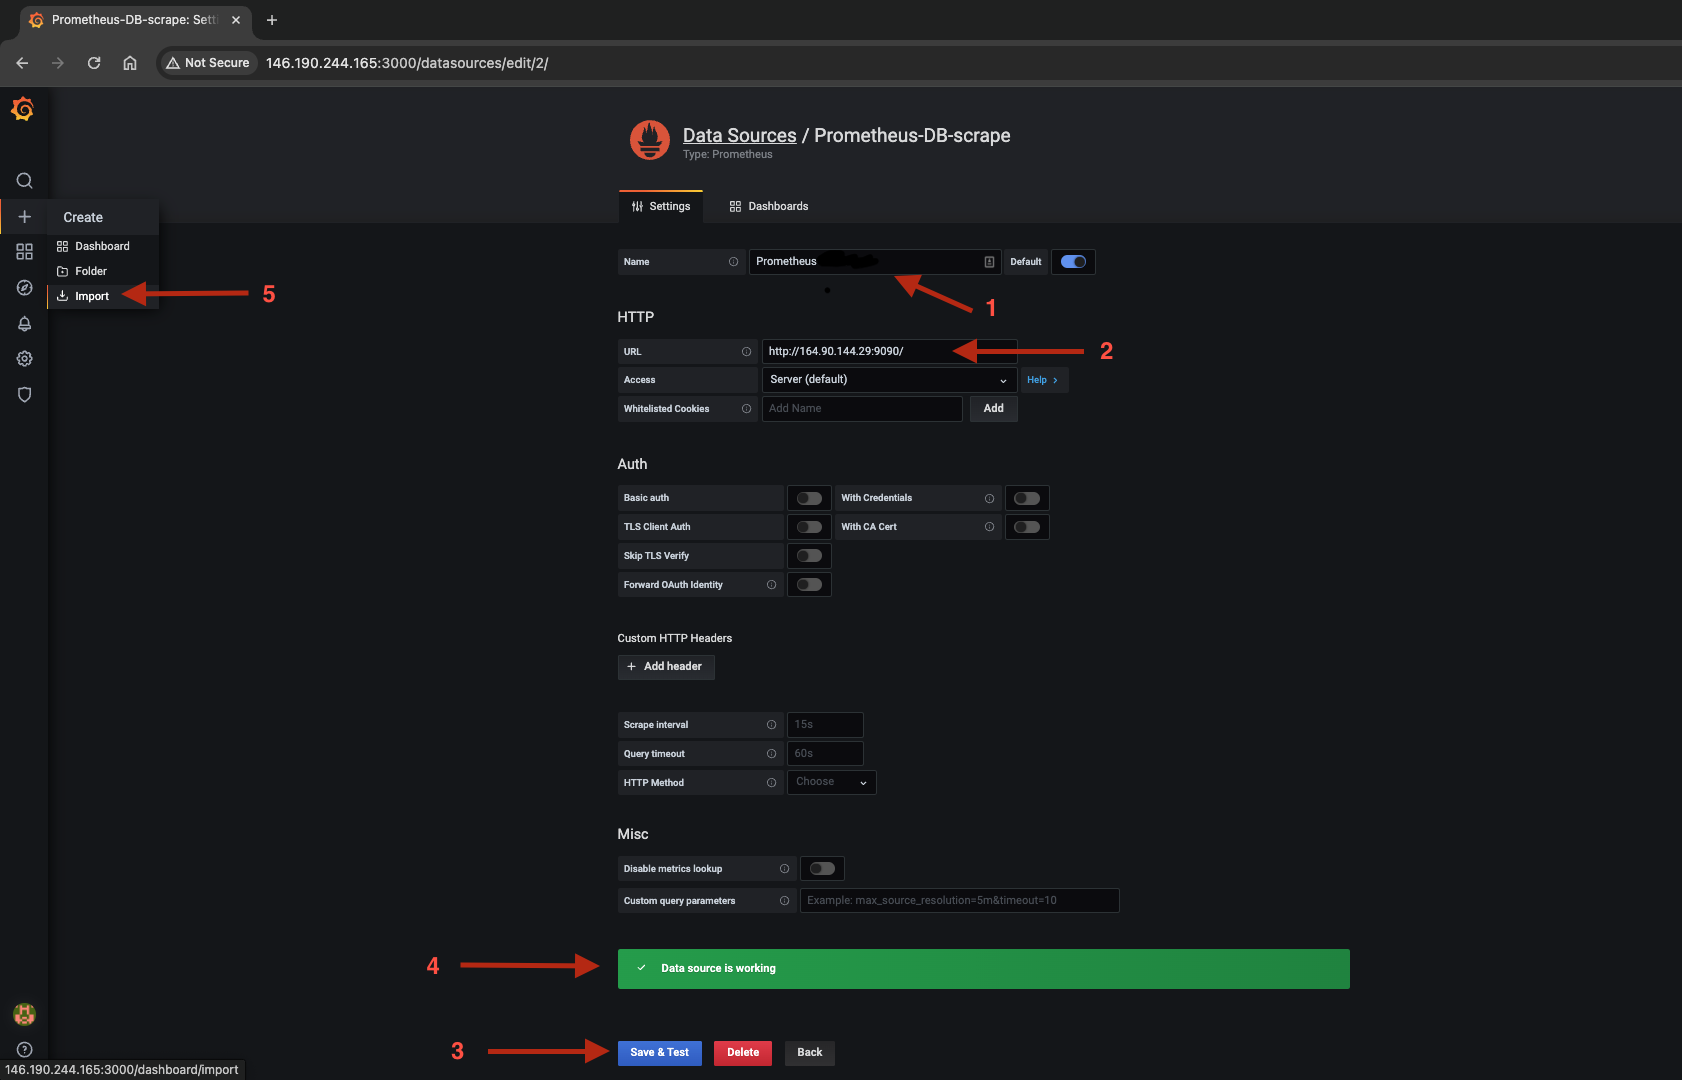
Step 5: Enter the name as Prometheus, URL (Prometheushostname:9090) and click “Save and Test”. If you see “Data source is working”, you have successfully added the data source. Once done, go to Create > Import.
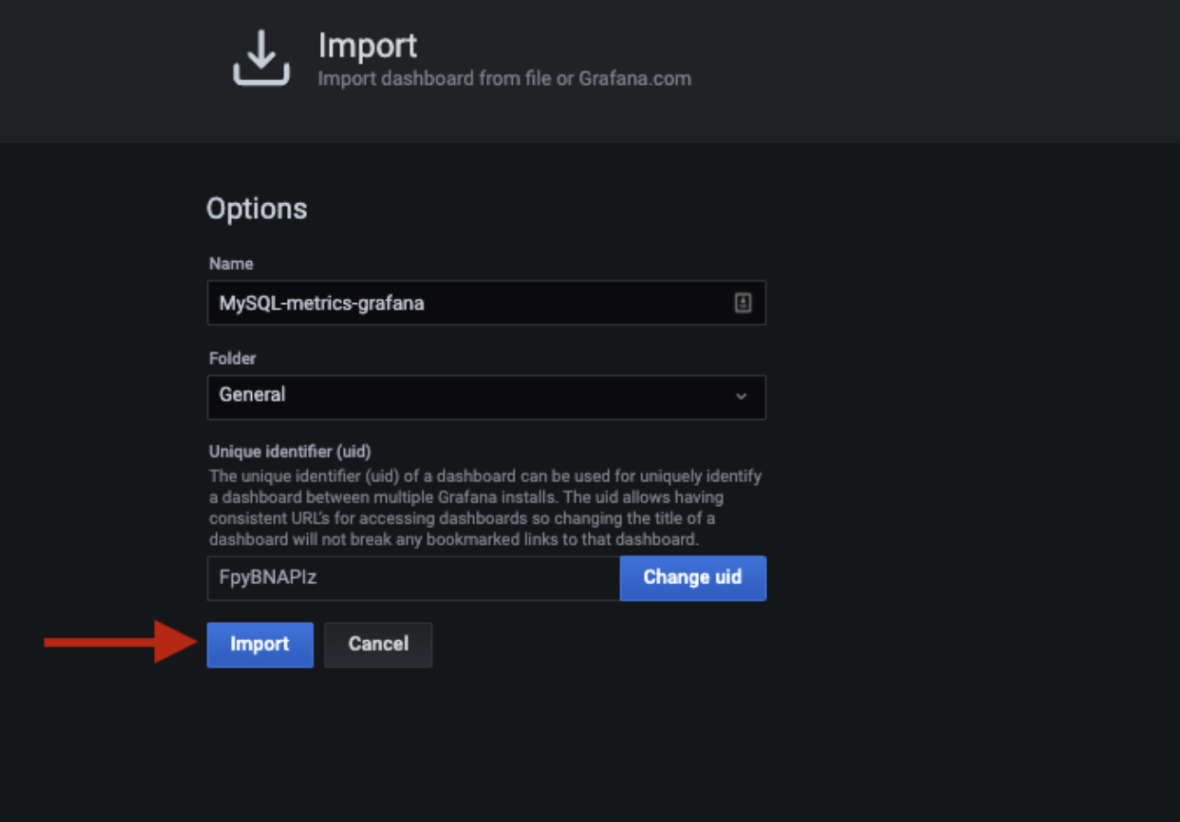
Step 6: You can configure the dashboard manually or import the dashboard by uploading a JSON file. Below are some examples of dashboard JSON files:
Step 7: Fill in the fields and submit.
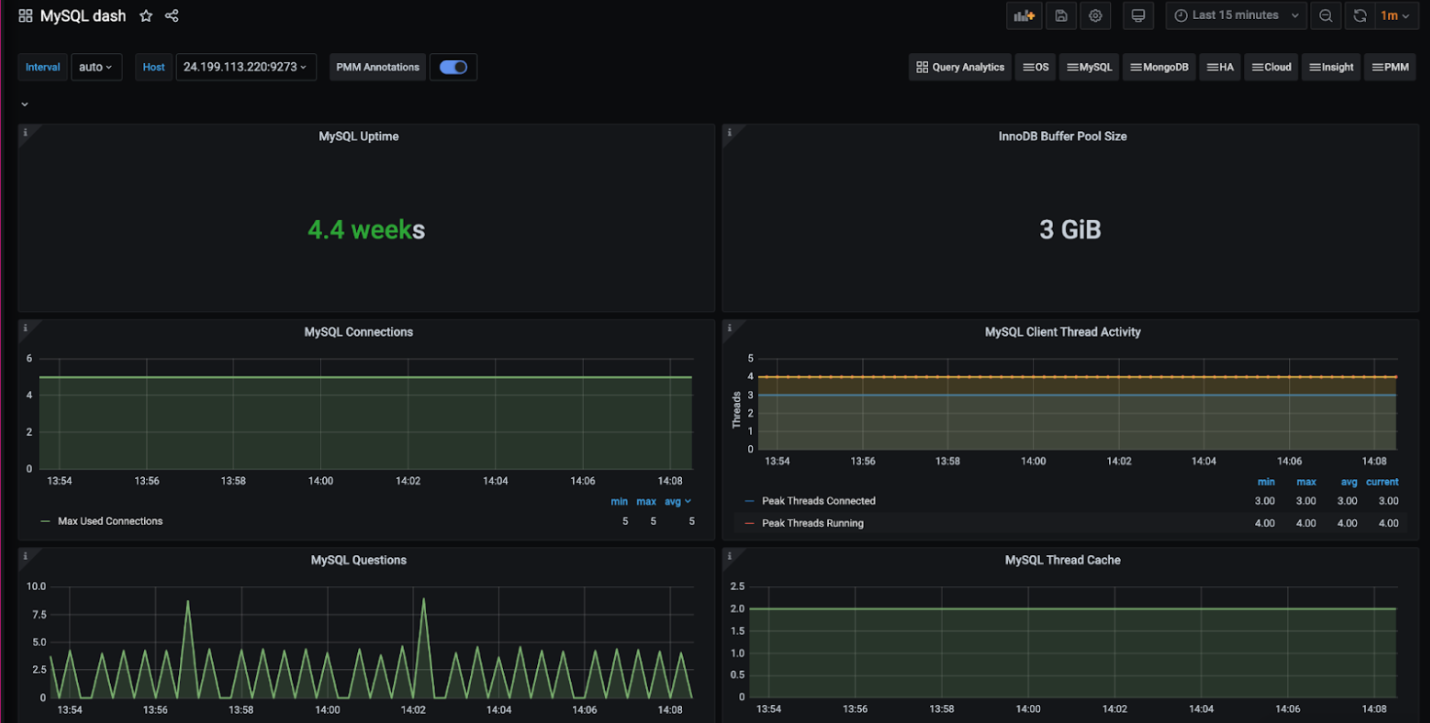
Step 8: Grafana dashboard is ready. Select the host and check if the metrics are visible or not. You can modify and edit the dashboard if needed.
Result
Setting up monitoring for DigitalOcean managed databases using Prometheus and Grafana increases your ability to ensure the performance, stability, and security of your database clusters.
By using Prometheus to scrape metrics and Grafana to visualize them, you gain comprehensive insight into database health and performance metrics.
This proactive approach enables efficient management and timely troubleshooting, which is crucial for maintaining optimal database operations. With the steps outlined in this documentation, you can easily implement robust monitoring tailored to your specific database needs and ensure the smooth operation of your DigitalOcean managed databases.