
Introduction
OpenSearch is an open source search and analytics suite that is derived from the Elasticsearch and Kibana branches. It supports real-time data transfer, advanced querying, and strong security, making it ideal for e-commerce, IT monitoring, and financial applications. OpenSearch is constantly evolving through active community development, with features such as SQL query support, machine learning, and alerting.
In this tutorial, you will learn the basics of creating dashboards using the Dashboard app and OpenSearch sample data. The sample data set includes existing visualizations that you can use or modify to create new ones. By the end of this tutorial, you will have mastered the basics of creating a new dashboard with multiple panels in OpenSearch dashboards.
Prerequisites
Before you begin, make sure that:
- A DigitalOcean account with access to managed OpenSearch.
- Basic knowledge of OpenSearch and data visualization concepts.
- Access the OpenSearch dashboard
Most common use cases for the OpenSearch dashboard
The dashboard app in OpenSearch dashboards allows you to visually display analytical, operational, and strategic data, provide a quick understanding of key trends and metrics, simplify data exploration, and deliver timely insights.
Here are three use cases for dashboards in OpenSearch:
- Monitoring e-commerce sales:
- Create a dashboard to track real-time sales metrics, including total revenue, average order value, and conversion rate.
- Visualize customer behavior, such as cart abandonment rates and product popularity, to optimize marketing strategies.
- Use alerts to notify the team of significant changes in sales patterns and help resolve any issues quickly.
- IT Infrastructure Monitoring:
- Set up dashboards to monitor server health, network performance, and application uptime across the infrastructure.
- Visualize key metrics such as CPU utilization, memory consumption, and network latency to ensure optimal performance.
- Implement alerts for critical thresholds, enabling rapid response to potential outages or performance degradation.
- Security incident tracking:
- Create dashboards to monitor and analyze security reports, including login attempts, firewall activity, and intrusion detection alerts.
- Track suspicious activity patterns in real-time to identify potential security breaches.
- Use visualization tools to correlate data across multiple sources and increase the ability to respond and effectively mitigate security incidents.
Step 1 – Create a Managed OpenSearch Database
- To create a managed Open Search database, go to the Databases section of the Control Panel and click "Create Database.".
- Select a “Data Center/Region.”.
- Select the desired VPC network from the region (if you have created multiple VPCs).
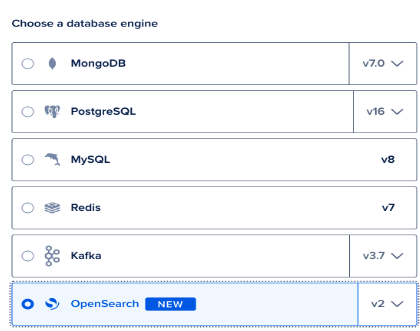
- “Select ”OpenSearch” as the database engine.
- Now select Database Configuration.
Note: You can change the configuration and upgrade at any time after the cluster is created. However, small scale is not currently supported.
- Open Search also supports scale-out storage. Hence, you can choose the storage size.
- Name the database cluster, select your desired project, and add tags (optional, if applicable)
- Click Create Database Cluster.
Step 2 – Create a dashboard and add existing visualizations
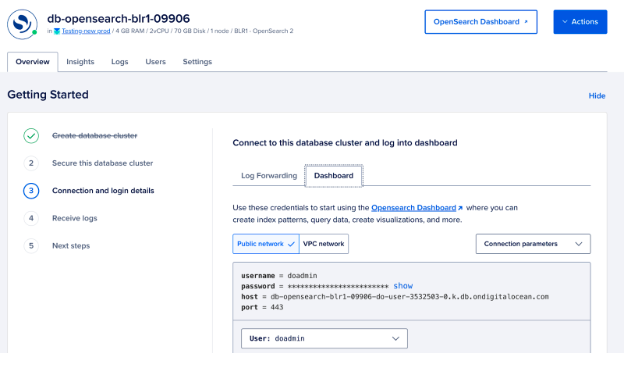
- From the DigitalOcean cloud control panel, click on the OpenSearch dashboard.
- Log in to the dashboard with the details provided in the cloud panel.
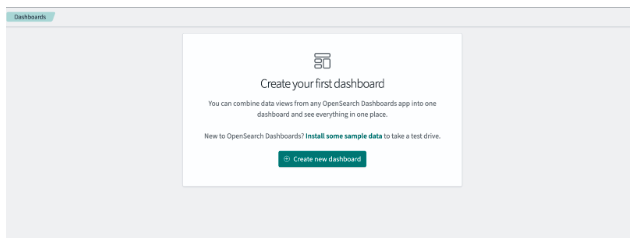
- After logging into OpenSearch, go to OpenSearch “Dashboards > Dashboard” in the top menu.
- From the Dashboards panel, select “Create Dashboard.”.
- Click the calendar icon and set the time filter to the last X days.
- In the panel, select “Add Existing.”.
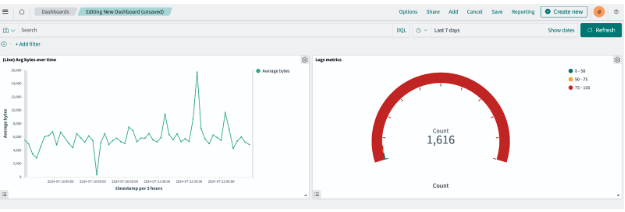
- In the Add panels window, select Line Avg Bytes over time, then close the panel.
You have successfully created a basic dashboard with a single panel that will be used in the rest of this tutorial.
Step 3 – Create a visualization
- Create a new visualization - From the dashboard toolbar, click "Create New.".
- “Select ”Gauge/Metrics” in the New Visualization window and select the desired indicator template.
- Save the Visualization – Click “Save” on the toolbar.
- Enter a title such as "Number of Metrics" for the gauge panel in the Save Visualization window.
- Click "Save and Return.".
The gauge chart visualization is now saved and you will be redirected to the dashboard. You should see two visualizations displayed on the dashboard.
Note: To visualize and explore data in OpenSearch dashboards, you can create a list template to retrieve data from OpenSearch. You have four different options: list templates, data sources, stored objects, and advanced settings. OpenSearch dashboards require an index template to specify which indexes you want to explore. An index template can point to a specific index, such as yesterday's report data, or all indexes containing your report data.
Result
Congratulations! You've learned how to create and visualize dashboards in DigitalOcean's managed OpenSearch database. We've covered setting up a new dashboard, using sample data, and adding images. With these skills, you can now effectively monitor and analyze your key metrics.