
Introduction
Uptime Kuma is a free, open source, self-hosted monitoring tool designed to help you track the availability and performance of your websites, applications, and other services. Inspired by services like UptimeRobot, Uptime Kuma offers a powerful yet user-friendly interface that gives you complete control over your monitoring needs.
In this tutorial, I will walk you through installing kuma uptime with Docker Compose in Portainer.
In this scenario, we will discuss the usage and monitoring of an example of another server and website.
Prerequisites
- A server with Ubuntu Server installed and root access.
- To buy Click Do it.
- Docker & Docker Compose installed
Example terms
Since the choice of creating users is up to you, and this also applies to setting the hostname, only a sample of monitored IP addresses and services are listed here.
- IP addresses and ports:
- Portainer: 203.0.113.1:9443
- Uptime Kuma 203.0.113.1:3001
- Supervised services:
- MyServer01: 192.0.2.254
- MyWebsite01: example.com
Step 1 – Preparing the Server
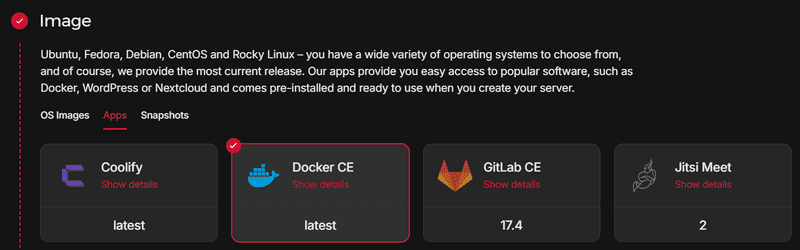
For this example, I will use the pre-installed application in Hetzner Cloud – Docker CE.
After installing the server, connect to SSH with root permissions.
Create a user with sudo privileges and add the new user to the Docker group.
I recommend updating your Ubuntu packages before continuing.
sudo apt update && sudo apt upgrade -y
First, we create a volume that Portinator will use to store its data.
docker volume create portainer_data
Use the following command to start Portinator on port 9443. It also opens port 8000 for insecure HTTP.
docker run -d -p 8000:8000 -p 9443:9443 --name portainer --restart=always -v /var/run/docker.sock:/var/run/docker.sock -v portainer_data:/data portainer/portainer-ce:2.21.5
We now have access to the server using our Portinar address.
https://203.0.113.1:9443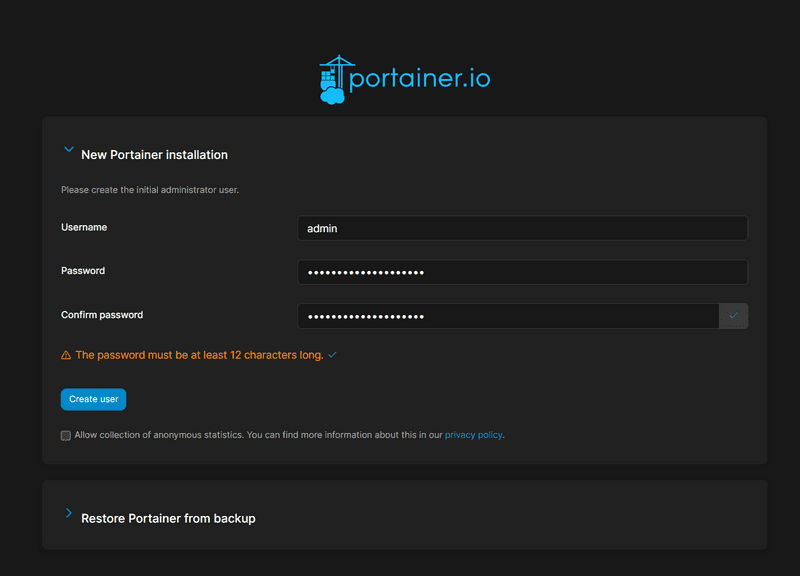
Step 1.1 – Setting up Portainer
Once we log into our portal, we are presented with the Environment Wizard where we select Get Started.
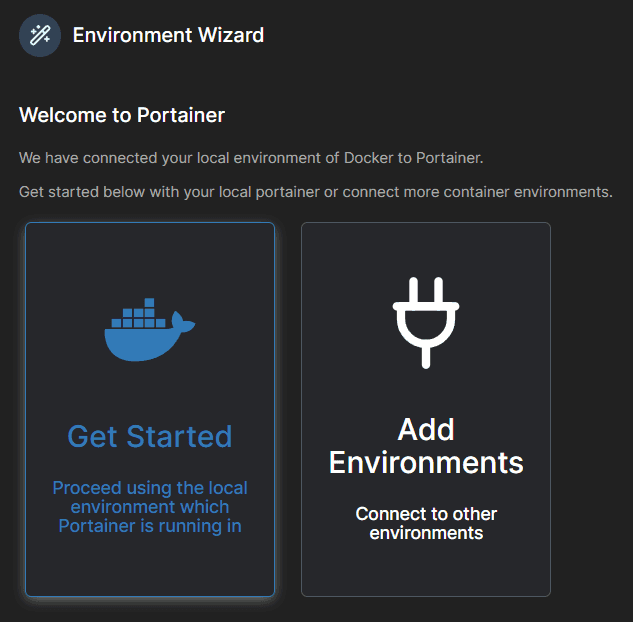
We choose our local environment.
Step 2 – Create the Uptime Kuma Stack
In the Portainer control panel on the left, select “Stacks.” Then select Add Stack in the top right corner.
The name can be anything, in our case uptime-kuma, the build method will be the default web editor and we will import Docker Compose as written below.
version: '3.3'
services:
uptime-kuma:
image: louislam/uptime-kuma:1
container_name: uptime-kuma
volumes:
- /docker-vol/uptime-kuma:/app/data # Here is a template for setting the directory /path/to/dir/uptime-kuma:/app/data
ports:
- 3001:3001
restart: always
security_opt:
- no-new-privileges:true
Once inserted, click Deploy the stack at the bottom of the page.
Step 3 – Access Uptime Kuma
Now we can visit our Uptime Kuma on port 3001.
http://203.0.113.1:3001/setup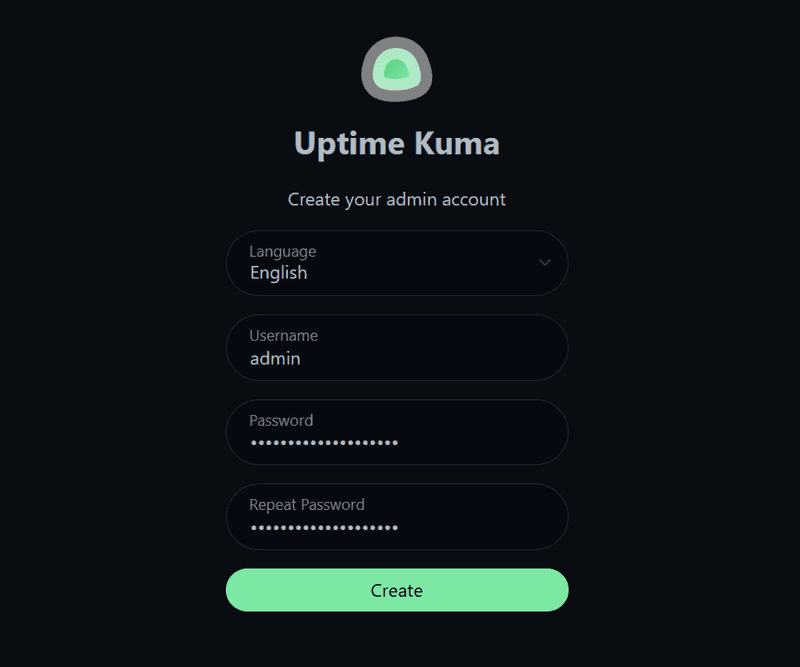
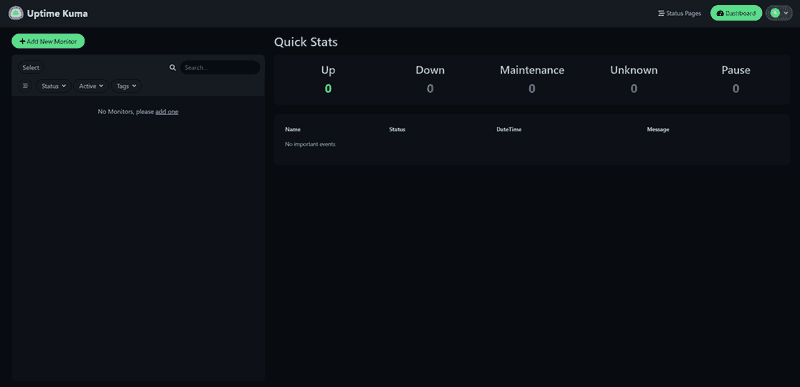
After logging in, we see our dashboard, which we will explain later. First, let's take a look at the settings of the application itself.
In the top right corner, click on our profile icon and click on the Settings box.
In the General section we can configure the initial settings of the application, I recommend setting the time zone correctly and if you want to connect Uptime Kuma to a domain later, select the initial base URL, if we use IP. , we do not need to fill in anything or click on Auto Get.
Step 4 – Monitoring Sample
We will consider an example of monitoring another Ubuntu server and website.
Return to the dashboard and click Add New Monitor at the top left.
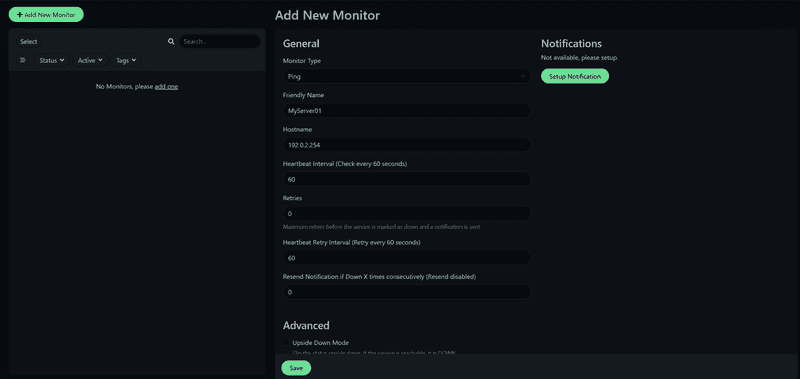
Step 4.1 – Monitoring Ubuntu Server
Now we will see an example of monitoring another Ubuntu server.
For example, you can monitor the server using ping, Uptime Kuma also offers a Push option which is more comprehensive. But we will show ping monitoring here.
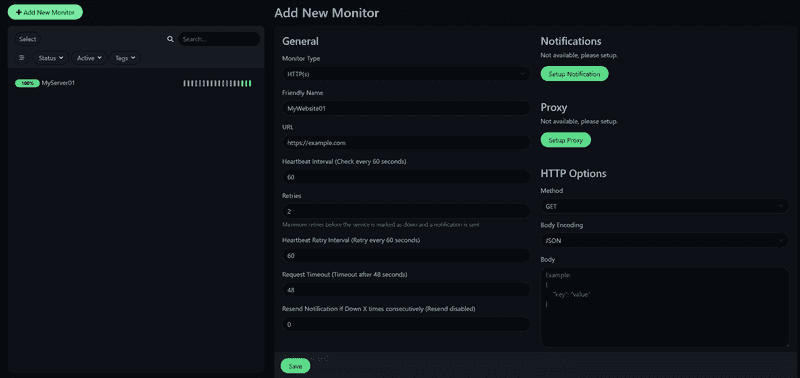
Step 4.2 – Monitoring a Website
Now we see an example of a website.
To track a web page, select the HTTP(s) tracking type.
Step 4.3 – Monitoring Settings
Here we will talk about the basic parameters that we can adjust for our monitor.
| Parameters | Description |
|---|---|
| Friendly name | The name under which our supervision is found. |
| Heart rate interval | The default interval for checks is 60 seconds. |
| Tries again. | The number of failed checks before the service is considered definitive. |
You can also choose alerts for each monitor that detects that the service is not running. There are many options to choose from, some of the most popular ones are Email (SMTP), Discord, Telegram, Webhook.
Step 5 – Create a status page
Now we will explain how to create a status page for your monitoring.
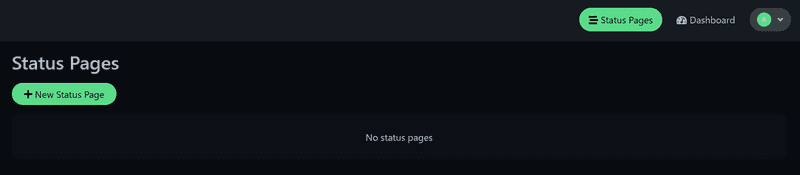
Click New Status Page. Choose a name for the status page and enter a slug. Once the status page is published, you can access it as follows:
http://203.0.113.1:3001/status/<your_input>After creating the page, we can set the title, icon, custom CSS, and more. We can also click Add Monitor, where we can add monitors that have been previously created.
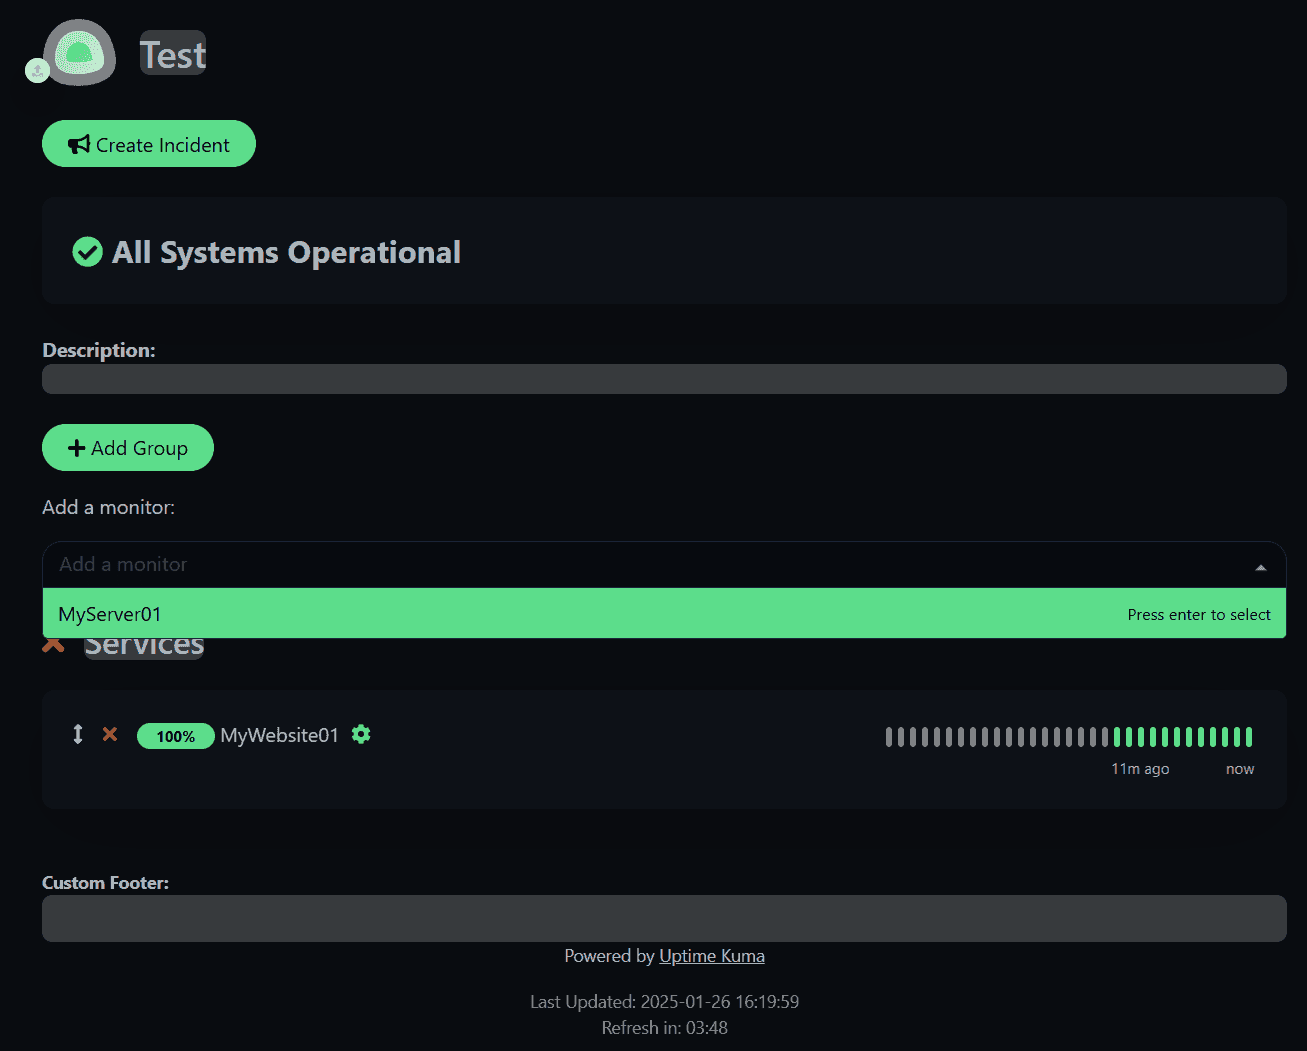
Now if we click Save, our status page will be published and visible to non-logged in users.
http://203.0.113.1:3001/status/testStep 6 – Create Maintenance
Another great tool is the ability to create maintenance. During maintenance, site monitoring is paused and a banner is displayed on the relevant status page with a maintenance notification, the affected views are highlighted in blue.
Click on your profile icon in the top right and click on “Maintenance.” Now “Schedule Maintenance.”.
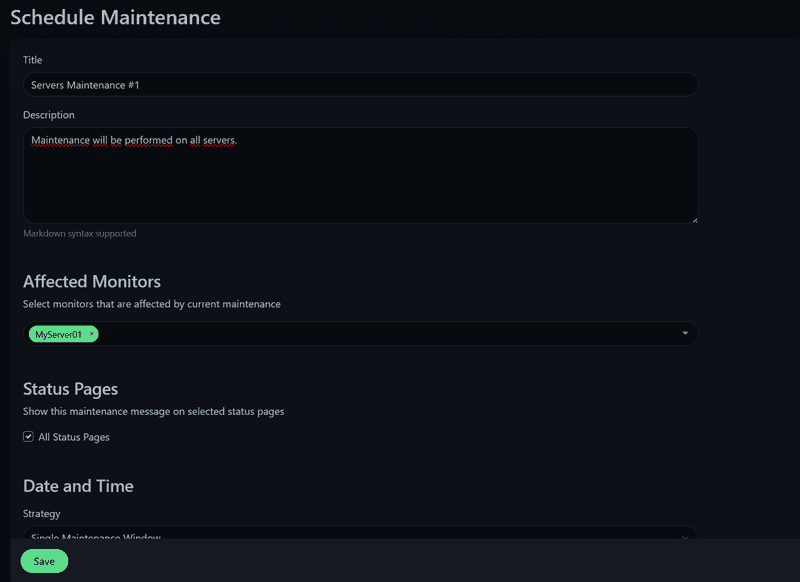
In specific maintenance settings, a time window can be selected, everything from a specific time to a recurring interval or CRON is available.
Once created, just click Save and the maintenance will be created and activated.
Result
I hope this tutorial helped you set up your status page. Uptime Kuma is highly customizable and I believe you will quickly get used to the magic of this monitoring tool and discover it for yourself.