Introduction
Apache Kafka supports various security protocols and authentication workflows to ensure that only authorized personnel and applications can connect to the cluster. In the default configuration, Kafka allows everyone access but no security checks are enabled. While useful for exploration and development, production deployments must be properly secured before being exposed to the outside world. Also, such environments must be monitored to ensure smooth operation and prevent potential failures.
In this tutorial, you will strengthen your Kafka installation by configuring TLS traffic encryption and SASL authentication to provide a standard username and password login flow. You will see how to configure the provided producer and consumer scripts to connect to a secure cluster. Then, you will learn how to export Kafka metrics and visualize them in Grafana. You will also learn how to access your cluster nodes and topics through an easy-to-use, web-based interface provided by AKHQ.
Prerequisites
- A droplet with at least 4GB of RAM and 2 processors. For Ubuntu Server, follow the initial server setup for setup instructions.
- Apache Kafka is installed and configured on your Droplet. For setup instructions, follow the Getting Started with Kafka tutorial. You only need to complete Step 1 and Step 2.
- Understand how Java manages keys and certificates. For more information, see the Java Keytool Essentials: Working with Java Keystores tutorial.
- Grafana is installed on your server or local machine. Please refer to the tutorial on how to install and secure Grafana on Ubuntu for instructions. You only need to complete the first four steps.
- A fully registered domain name points to your droplet. This tutorial uses your_domain throughout and points to the same domain name that is required by Grafana. You can purchase a domain name at Namecheap, get a domain name for free at Freenom, or use a domain registrar of your choice.
Step 1 – Configure Kafka Security Protocols
In its stock configuration, Kafka allows anyone to connect to it without checking the origin of the request. This means that your cluster is accessible to everyone by default. While it is good for testing, as it reduces the maintenance burden on local machines and private installations, production and public-level Kafka installations should have security features enabled to prevent unauthorized access.
In this step, you will configure your Kafka broker to use TLS encryption for traffic between the broker and consumers. You will also set up SASL as the authentication framework for authentication when connecting to the cluster.
TLS certificate generation and stores
To generate the certificates and keys needed to set up TLS, you will use the script available in the Confluent Platform Security Tools repository. First, clone it into your home directory by running the following command:
git clone https://github.com/confluentinc/confluent-platform-security-tools.git ~/kafka-sslGo to it:
cd ~/kafka-sslThe script you use is called kafka-generate-ssl-automatic.sh and asks you to provide your country, state, organization, and city as environment variables. These parameters are used to generate the certificates, but their contents are unimportant. You also need to provide a password, which is used to secure the Java trust and keystore that is created.
To set the required environment variables, run the following commands, replacing your_tls_password with your desired value:
export COUNTRY=US
export STATE=NY
export ORGANIZATION_UNIT=SE
export CITY=New York
export PASSWORD=your_tls_password
Note that PASSWORD must be at least six characters.
Give the script executable permissions by running the following:
chmod +x kafka-generate-ssl-automatic.shThen run it to generate the required files:
./kafka-generate-ssl-automatic.shThere will be a lot of output. Once completed, list the files in the directory:
ls -lThe output should look like this:
Outputrw-rw-r-- 1 kafka kafka 964 May 13 09:33 README.md
-rw-rw-r-- 1 kafka kafka 1063 May 13 09:34 cert-file
-rw-rw-r-- 1 kafka kafka 1159 May 13 09:34 cert-signed
-rwxrw-r-- 1 kafka kafka 6016 May 13 09:33 kafka-generate-ssl-automatic.sh
-rwxrwxr-x 1 kafka kafka 7382 May 13 09:33 kafka-generate-ssl.sh
drwxrwxr-x 2 kafka kafka 4096 May 13 09:34 keystore
-rw-rw-r-- 1 kafka kafka 184929 May 13 09:33 single-trust-store-diagram.pages
-rw-rw-r-- 1 kafka kafka 36980 May 13 09:33 single-trust-store-diagram.pdf
drwxrwxr-x 2 kafka kafka 4096 May 13 09:34 truststore
You will see that the certificate, trust, and keystore have been created successfully.
Configuring Kafka for TLS and SASL
Now that you have the necessary files to enable TLS encryption, you will configure Kafka to use them and authenticate users using SASL.
You will modify the server.properties file in the config/kraft section of the installation directory. You installed it under Kafka in your home directory as part of the prerequisites. Go to it by running:
cd ~/kafkaOpen the main configuration file for editing:
nano config/kraft/server.properties
Find the following lines:
...
listeners=PLAINTEXT://:9092,CONTROLLER://:9093
# Name of listener used for communication between brokers.
inter.broker.listener.name=PLAINTEXT
# Listener name, hostname and port the broker will advertise to clients.
# If not set, it uses the value for "listeners".
advertised.listeners=PLAINTEXT://localhost:9092
Change them to the following, replacing PLAINTEXT with BROKER:
...
listeners=BROKER://:9092,CONTROLLER://:9093
# Name of listener used for communication between brokers.
inter.broker.listener.name=BROKER
# Listener name, hostname and port the broker will advertise to clients.
# If not set, it uses the value for "listeners".
advertised.listeners=BROKER://localhost:9092
Then find the line listener.security.protocol.map:
# Maps listener names to security protocols, the default is for them to be the same. See the config documentation for more details
listener.security.protocol.map=CONTROLLER:PLAINTEXT,PLAINTEXT:PLAINTEXT,SSL:SSL,SASL_PLAINTEXT:SASL_PLAINTEXT,SASL_SSL:SASL_SSL
Map BROKER to SASL_SSL by embedding the definition with the value:
# Maps listener names to security protocols, the default is for them to be the same. See the config documentation for more details
listener.security.protocol.map=BROKER:SASL_SSL,CONTROLLER:PLAINTEXT,PLAINTEXT:PLAINTEXT,SSL:SSL,SASL_PLAINTEXT:SASL_PLAINTEXT,SASL_SSL:SASL_SSL
Here, you have added the BROKER alias definition that you used in the listeners and mapped it to SASL_SSL, which indicates that both SSL (the former name for TLS) and SASL should be used.
Then go to the end of the file and add the following lines:
ssl.truststore.location=/home/kafka/kafka-ssl/truststore/kafka.truststore.jks
ssl.truststore.password=your_tls_password
ssl.keystore.location=/home/kafka/kafka-ssl/keystore/kafka.keystore.jks
ssl.keystore.password=your_tls_password
ssl.key.password=your_tls_password
ssl.client.auth=required
sasl.enabled.mechanisms=PLAIN
sasl.mechanism.controller.protocol=PLAIN
sasl.mechanism.inter.broker.protocol=PLAIN
authorizer.class.name=org.apache.kafka.metadata.authorizer.StandardAuthorizer
allow.everyone.if.no.acl.found=false
super.users=User:admin
First, you define the locations and passwords for the trust and key stores you created. You set the ssl.client.auth parameter to required, instructing Kafka to deny any connections that do not present a valid TLS certificate. Then, you set the SASL mechanism to PLAIN, which enables it. PLAIN differs from PLAINTEXT in that it requires the use of an encrypted connection, and both rely on a username and password combination.
Finally, you set StandardAuthorizer as the authorizer class, which checks the credentials against the configuration file you will create soon. Next, you set the allow.everyone.if.no.acl.found parameter to false, restricting access for connections with inappropriate credentials. You also select the admin user as the superuser, since there must be at least one to perform administrative tasks on the cluster.
Don't forget to replace your_tls_password with the password you entered into the script in the previous section, then save and close the file.
Now that you have Kafka configured, you need to create a file that defines the credentials allowed for the connection. Kafka supports Java Authentication and Authorization Service (JAAS), a framework for implementing authentication workflows, and accepts credential definitions in the JAAS format.
You will store them in a file called kafka-server-jaas.conf in config/kraft. Create and open it for editing by running the following:
nano config/kraft/kafka-server-jaas.confAdd the following lines:
KafkaServer {
org.apache.kafka.common.security.plain.PlainLoginModule required
username="admin"
password="admin"
user_admin="admin";
};
The username and password specify the primary credentials that will be used to communicate between brokers in the cluster when there are multiple nodes. The user_admin line defines a user whose username is admin with a password of admin that can connect to the broker from outside. When finished, save and close the file.
Kafka needs to be aware of the kafka-server-jaas.conf file because it completes the main configuration. You need to modify the kafka systemd service configuration and pass a reference to it. Run the following command to open the service for editing:
sudo systemctl edit --full kafkaBy passing –full you will access the full contents of the service. Find the ExecStart line:
...
User=kafka
ExecStart=/bin/sh -c '/home/kafka/kafka/bin/kafka-server-start.sh /home/kafka/kafka/config/kraft/server.properties > /home/kafka/kafka/kafka.log 2>&1'
...
Add the following line above it so that it looks like this:
...
User=kafka
Environment="KAFKA_OPTS=-Djava.security.auth.login.config=/home/kafka/kafka/config/kraft/kafka-server-jaas.conf"
ExecStart=/bin/sh -c '/home/kafka/kafka/bin/kafka-server-start.sh /home/kafka/kafka/config/kraft/server.properties > /home/kafka/kafka/kafka.log 2>&1'
...
This will set the java.security.auth.login.config parameter in the configuration to the path of the JAAS configuration file, separating it from the main Kafka configuration. When you are done, save and close the file. Reload the service definition by running:
sudo systemctl daemon-reloadThen, restart Kafka:
sudo systemctl restart kafkaYou have now configured TLS encryption and SASL authentication for your Kafka installation, and now you will learn how to connect to it with the provided console scripts.
Step 2 – Connect to a secure cluster
In this step, you will learn how to connect to a secure Kafka cluster using JAAS configuration files with the provided console scripts.
The scripts provided for manipulating message production and consumption topics also use Java internally and therefore accept JAAS configuration that describes the locations of the trust and key store as well as SASL authentication.
You will save this configuration in a file called client-jaas.conf in your home directory. Create and open it for editing:
nano ~/client-jaas.confAdd the following lines:
security.protocol=SASL_SSL
ssl.truststore.location=/home/kafka/kafka-ssl/truststore/kafka.truststore.jks
ssl.truststore.password=your_tls_password
ssl.keystore.location=/home/kafka/kafka-ssl/keystore/kafka.keystore.jks
ssl.keystore.password=your_tls_password
sasl.mechanism=PLAIN
sasl.jaas.config=org.apache.kafka.common.security.plain.PlainLoginModule required username="admin" password="admin";
ssl.endpoint.identification.algorithm=
As before, you set the protocol to SASL_SSL and provide the paths and password for the keystores and truststores you created. Then, you set the SASL mechanism to PLAIN and provide credentials for the user admin. You explicitly clear the ssl.endpoint.identification.algorithm parameter to avoid connection problems, as the initial scripts set the hostname of the machine they are running on as the certificate endpoint, which may not be correct.
Replace your_tls_password with the appropriate value, then save and close the file.
To pass this file to the scripts, you can use the --command-config parameter. Create a new topic in the cluster with the following command:
bin/kafka-topics.sh --bootstrap-server localhost:9092 --create --topic new_topic --command-config ~/client-jaas.confThe command should run successfully:
Output...
Created topic new_topic.
To verify that it has been created, list all threads in the cluster by running:
bin/kafka-topics.sh --bootstrap-server localhost:9092 --list --command-config ~/client-jaas.confThe output will show that new_topic exists:
Output__consumer_offsets
new_topic
...
In this section, you have configured your Kafka installation to use TLS encryption for traffic and SASL for authentication with a username and password combination. Now you will learn how to export various Kafka metrics via JMX using Prometheus.
Step 3 – Monitor Kafka JMX metrics using Prometheus
In this section, you will use Prometheus to collect Kafka metrics and make them queried in Grafana. This requires setting up a JMX exporter for Kafka and connecting it to Prometheus.
[Java Management Extensions (JMX) is a framework for Java applications that allows developers to collect generic and custom metrics about application performance at runtime in a standard format. Since Kafka is written in Java, it supports the JMX protocol and exposes its custom metrics through it, such as the status of topics and brokers.Configuring Kafka and Prometheus
Before continuing, you need to install Prometheus. On Ubuntu machines, you can use apt. Its repositories by running:
sudo apt updateThen, install Prometheus:
sudo apt install prometheus -yFor other platforms, please follow the installation instructions on the official website.
Once installed, you need to add the JMX exporter library for Prometheus to your Kafka installation. Go to the versions page and select the latest version with javaagent in the name. At the time of writing, the latest available version was 0.20.0. Use the following command to download it to the libs/ directory where Kafka is installed:
curl https://repo.maven.apache.org/maven2/io/prometheus/jmx/jmx_prometheus_javaagent/0.20.0/jmx_prometheus_javaagent-0.20.0.jar -o ~/kafka/libs/jmx_prometheus_javaagent.jarThe JMX exporting library will now be selected by Kafka.
Before enabling the exporter, you need to specify what metrics it will report to Prometheus, and you save this configuration in a file called jmx-exporter.yml in your Kafka installation's config/. The JMX exporter project provides a suitable default configuration, so run the following command to save it as jmx-exporter.yml in your Kafka installation's config/:
curl https://raw.githubusercontent.com/prometheus/jmx_exporter/main/example_configs/kafka-2_0_0.yml -o ~/kafka/config/jmx-exporter.ymlNext, you need to modify the Kafka systemd service to enable the exporter. You need to modify the KAFKA_OPTS environment variable to include the exporter as well as its configuration. Run the following command to edit the service:
sudo systemctl edit --full kafkaChange the Environment line to the following:
Environment="KAFKA_OPTS=-Djava.security.auth.login.config=/home/kafka/kafka/config/kraft/kafka-server-jaas.conf -javaagent:/home/kafka/kafka/libs/jmx_prometheus_javaagent.jar=7075:/home/kafka/kafka/config/jmx-exporter.yml"
Here, you use the -javaagent argument to initialize the JMX exporter with its configuration.
When you're done, save and close the file, then start Kafka by running:
sudo systemctl restart kafkaAfter a minute, check that the JMX exporter is running by querying whether port 7075 is in use:
sudo ss -tunelp | grep 7075The output should look like this:
Outputtcp LISTEN 0 3 *:7075 *:* users:(("java",pid=6311,fd=137)) uid:1000 ino:48151 sk:8 cgroup:/system.slice/kafka.service v6only:0 <->This line indicates that port 7075 is used by a Java process started by the Kafka service that points to the JMX exporter.
Now you will configure Prometheus to monitor exported JMX metrics. Its main configuration file is located at /etc/prometheus/prometheus.yml, so open it for editing:
sudo nano /etc/prometheus/prometheus.ymlFind the following lines:
...
# A scrape configuration containing exactly one endpoint to scrape:
# Here it's Prometheus itself.
scrape_configs:
# The job name is added as a label `job=<job_name>` to any timeseries scraped from this config.
- job_name: 'prometheus'
# Override the global default and scrape targets from this job every 5 seconds.
scrape_interval: 5s
scrape_timeout: 5s
# metrics_path defaults to '/metrics'
# scheme defaults to 'http'.
static_configs:
- targets: ['localhost:9090']
- job_name: node
# If prometheus-node-exporter is installed, grab stats about the local
# machine by default.
static_configs:
- targets: ['localhost:9100']
In the scrape_configs section that specifies which endpoints Prometheus should watch, add a new section for scraping Kafka metrics:
# A scrape configuration containing exactly one endpoint to scrape:
# Here it's Prometheus itself.
scrape_configs:
# The job name is added as a label `job=<job_name>` to any timeseries scraped from this config.
- job_name: 'prometheus'
# Override the global default and scrape targets from this job every 5 seconds.
scrape_interval: 5s
scrape_timeout: 5s
# metrics_path defaults to '/metrics'
# scheme defaults to 'http'.
static_configs:
- targets: ['localhost:9090']
- job_name: node
# If prometheus-node-exporter is installed, grab stats about the local
# machine by default.
static_configs:
- targets: ['localhost:9100']
- job_name: 'kafka'
static_configs:
- targets: ['your_domain:7075']
A Kafka job has a target that points to a JMX exporting endpoint.
Remember to replace your_domain with your domain name, then save and close the file. Then, start Prometheus by running:
sudo systemctl restart prometheusIn your browser, navigate to port 9090 on your domain. You will access the Prometheus interface. In the Status section, click on Targets to list the jobs:
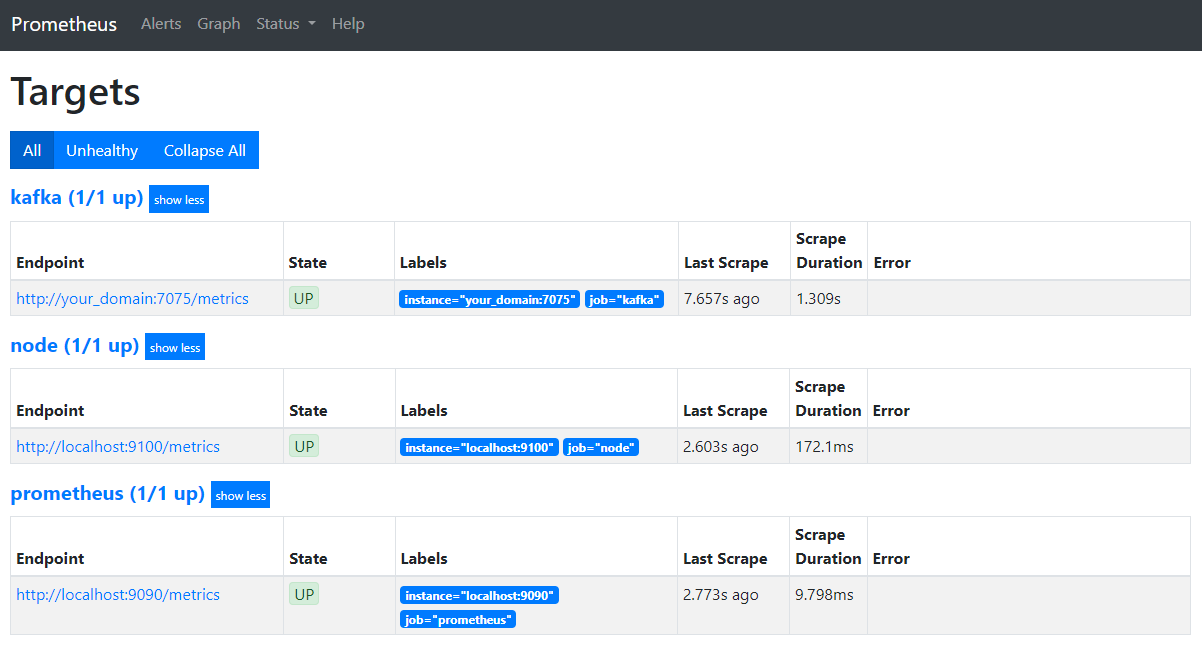
Notice that Prometheus has taken over the Kafka job and started scraping its metrics. Now you will learn how to access them in Grafana.
Querying metrics in Grafana
As part of the prerequisites, you have installed Grafana on your Droplet and placed it on your_domain. Go to it in your browser and in the Connections section of the sidebar, click Add New Connection, then type Prometheus in the search field.
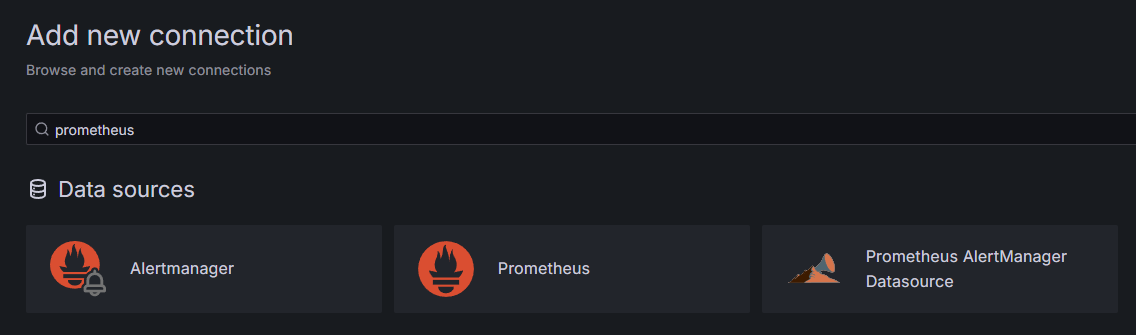
Click on Prometheus, then click on the Add New Data Source button in the top right. You will be prompted to fill in the address of the Prometheus instance:
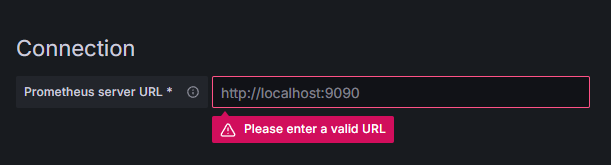
Enter http://your_domain_name:9090, replacing your actual domain name, then scroll down and press Save & test. You should get a success message:

The Prometheus connection has been added to Grafana. Press Explore in the sidebar, and you will be prompted to select a metric. You can type in kafka_ to list all the metrics related to the cluster, as shown:
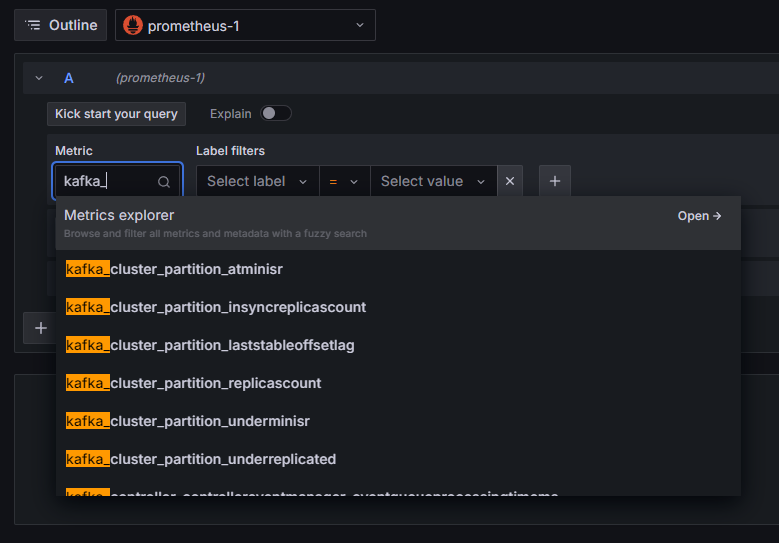
For example, select the kafka_log_log_size metric, which shows how large the internal disk log is in each partition, then press Run query in the top right corner. You will see the resulting sizes over time for each of the available topics:
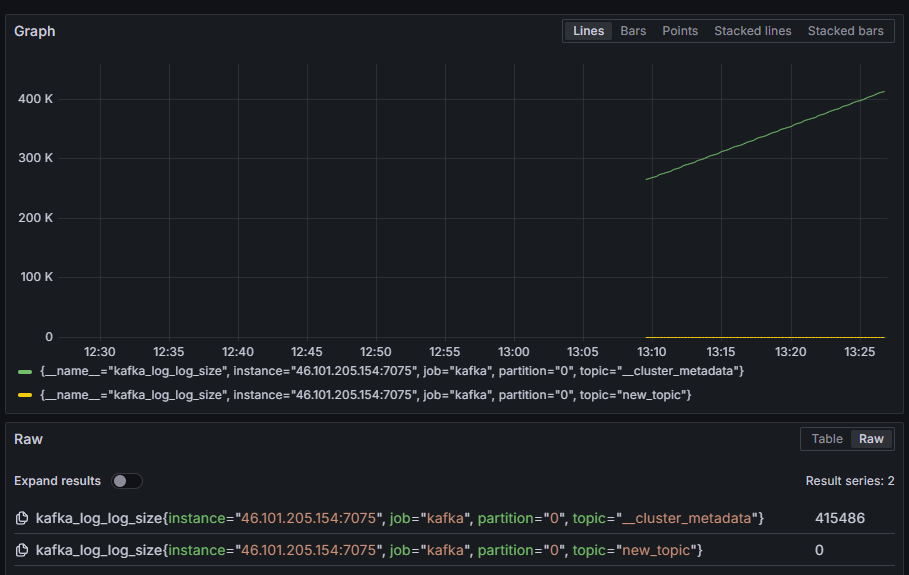
At this point, you have set up the JMX exporter metrics that Kafka provides and configured Prometheus to scrape them. Then, you have connected to it from within Grafana and performed a query on the Kafka metrics. Now you will learn how to manage a Kafka cluster using a web interface.
Step 4 – Managing Kafka Clusters with AKHQ
In this step, you will learn how to set up and use AKHQ, a web application for managing Kafka clusters. It allows you to list and manipulate topics, partitions, consumer groups, and configuration parameters, as well as produce and consume messages from topics from a single location.
You will store the executable and its configuration file in a directory called akhq. Create it in your home directory by running the following:
mkdir ~/akhqGo to it:
cd ~/akhqIn your browser, visit the official releases page and copy the link to the latest JAR file. At the time of writing, the latest version was 0.24.0. Run the following command to download it to your home directory:
curl -L https://github.com/tchiotludo/akhq/releases/download/0.24.0/akhq-0.24.0-all.jar -o ~/akhq/akhq.jarYou have now downloaded AKHQ and are ready to define its configuration to connect to your cluster. You will save it in a file called akhq-config.yml. Create and open it for editing by running the following:
nano ~/akhq/akhq-config.ymlAdd the following lines:
akhq:
connections:
localhost-sasl:
properties:
bootstrap.servers: "localhost:9092"
security.protocol: SASL_SSL
sasl.mechanism: PLAIN
sasl.jaas.config: org.apache.kafka.common.security.plain.PlainLoginModule required username="admin" password="admin";
ssl.truststore.location: /home/kafka/kafka-ssl/truststore/kafka.truststore.jks
ssl.truststore.password: secret
ssl.keystore.location: /home/kafka/kafka-ssl/keystore/kafka.keystore.jks
ssl.keystore.password: secret
ssl.key.password: secret
ssl.endpoint.identification.algorithm: ""
This is a basic AKHQ configuration that specifies a cluster at localhost:9092 with the SASL and TLS parameters specified. Multiple clusters are also supported simultaneously as you can define as many connections as you want. This makes AKHQ versatile for Kafka management. When you are done, save and close the file.
Next, you need to define a systemd service to run AKHQ in the background. Systemd services can be started, stopped, and restarted continuously.
You store the service configuration in a file named code-server.service in the /lib/systemd/system directory, where systemd stores its services. Create it using your text editor:
sudo nano /etc/systemd/system/akhq.serviceAdd the following lines:
[Unit]
Description=akhq
[Service]
Type=simple
User=kafka
ExecStart=/bin/sh -c 'java -Dmicronaut.config.files=/home/kafka/akhq/akhq-config.yml -jar /home/kafka/akhq/akhq.jar'
Restart=on-abnormal
[Install]
WantedBy=multi-user.target
First you specify the service description. Then in the [Service] field you define the service type (simple means that the command should be executed simply) and provide the command that will be executed. You also specify that the user it will run as is kafka and that it should be automatically restarted if the service exits.
The [Install] section instructs the system to start this service when you can log in to your server. When finished, save and close the file.
Load the service settings by running:
sudo systemctl daemon-reloadStart the AKHQ service by running the following command:
sudo systemctl start akhqThen, check that it started correctly by viewing its status:
sudo systemctl status akhqThe output should look like this:
Output● akhq.service - akhq
Loaded: loaded (/etc/systemd/system/akhq.service; disabled; vendor preset: enabled)
Active: active (running) since Wed 2024-05-15 07:37:10 UTC; 3s ago
Main PID: 3241 (sh)
Tasks: 21 (limit: 4647)
Memory: 123.3M
CPU: 4.474s
CGroup: /system.slice/akhq.service
├─3241 /bin/sh -c "java -Dmicronaut.config.files=/home/kafka/akhq/akhq-config.yml -jar /home/kafka/akhq/akhq.jar"
└─3242 java -Dmicronaut.config.files=/home/kafka/akhq/akhq-config.yml -jar /home/kafka/akhq/akhq.jar
AKHQ is now running in the background. By default, it is displayed on port 8080. In your browser, navigate to your domain with that port to access it. You will see the default view, which shows a list of topics:
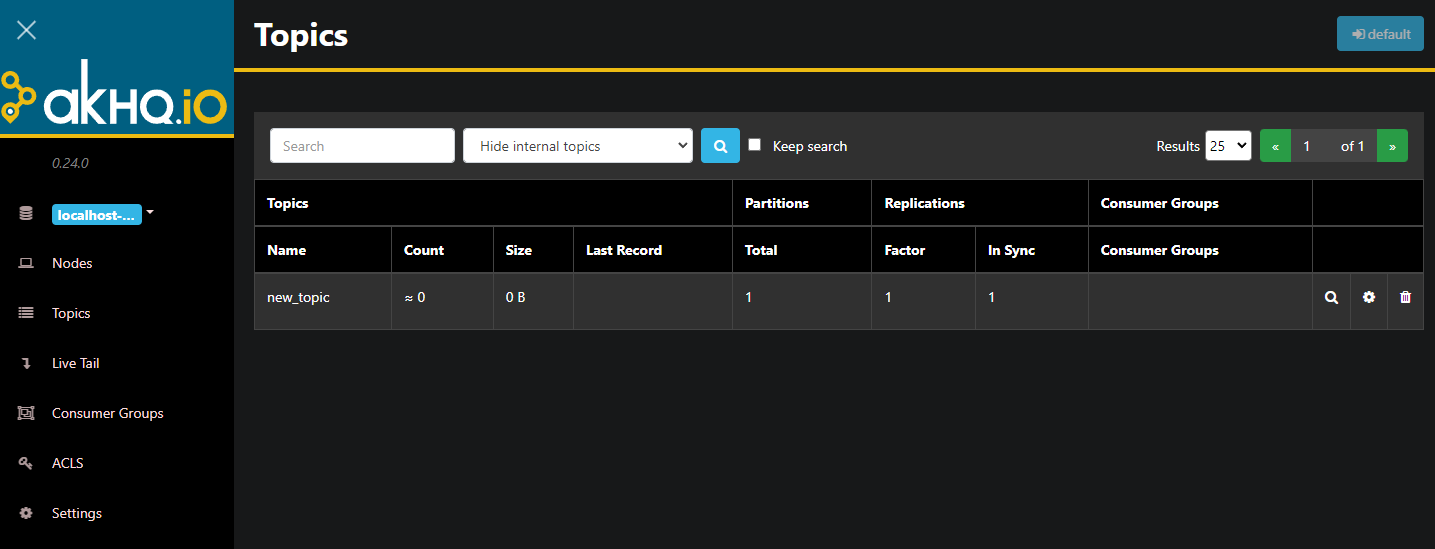
You can double-click on the row with the topic in the table to access it for a detailed view:
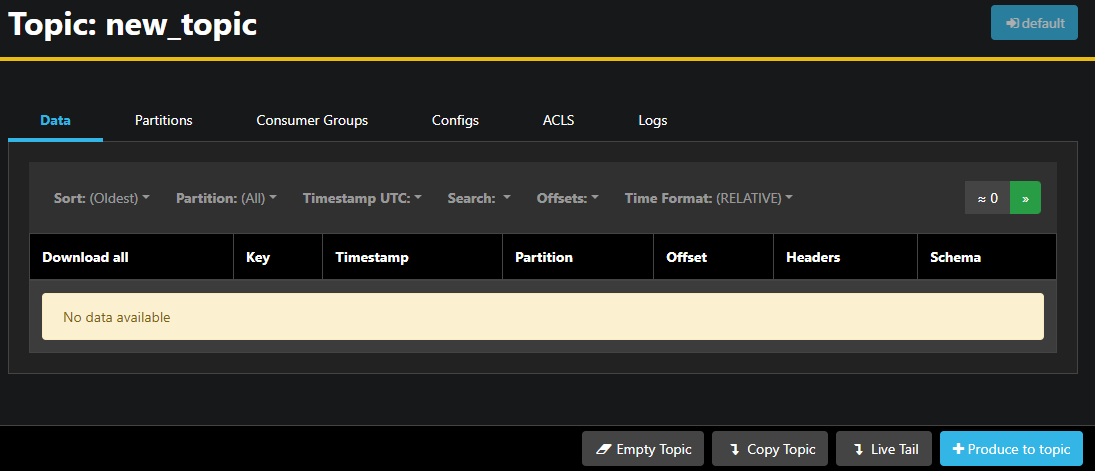
AKHQ allows you to view the messages in the topic as well as the partitions, consumer groups and their configuration. You can also empty or copy the topic using the buttons on the bottom right.
Since the new_topic topic is empty, press the Produce to topic button, which opens the interface for selecting the parameters of the new message:
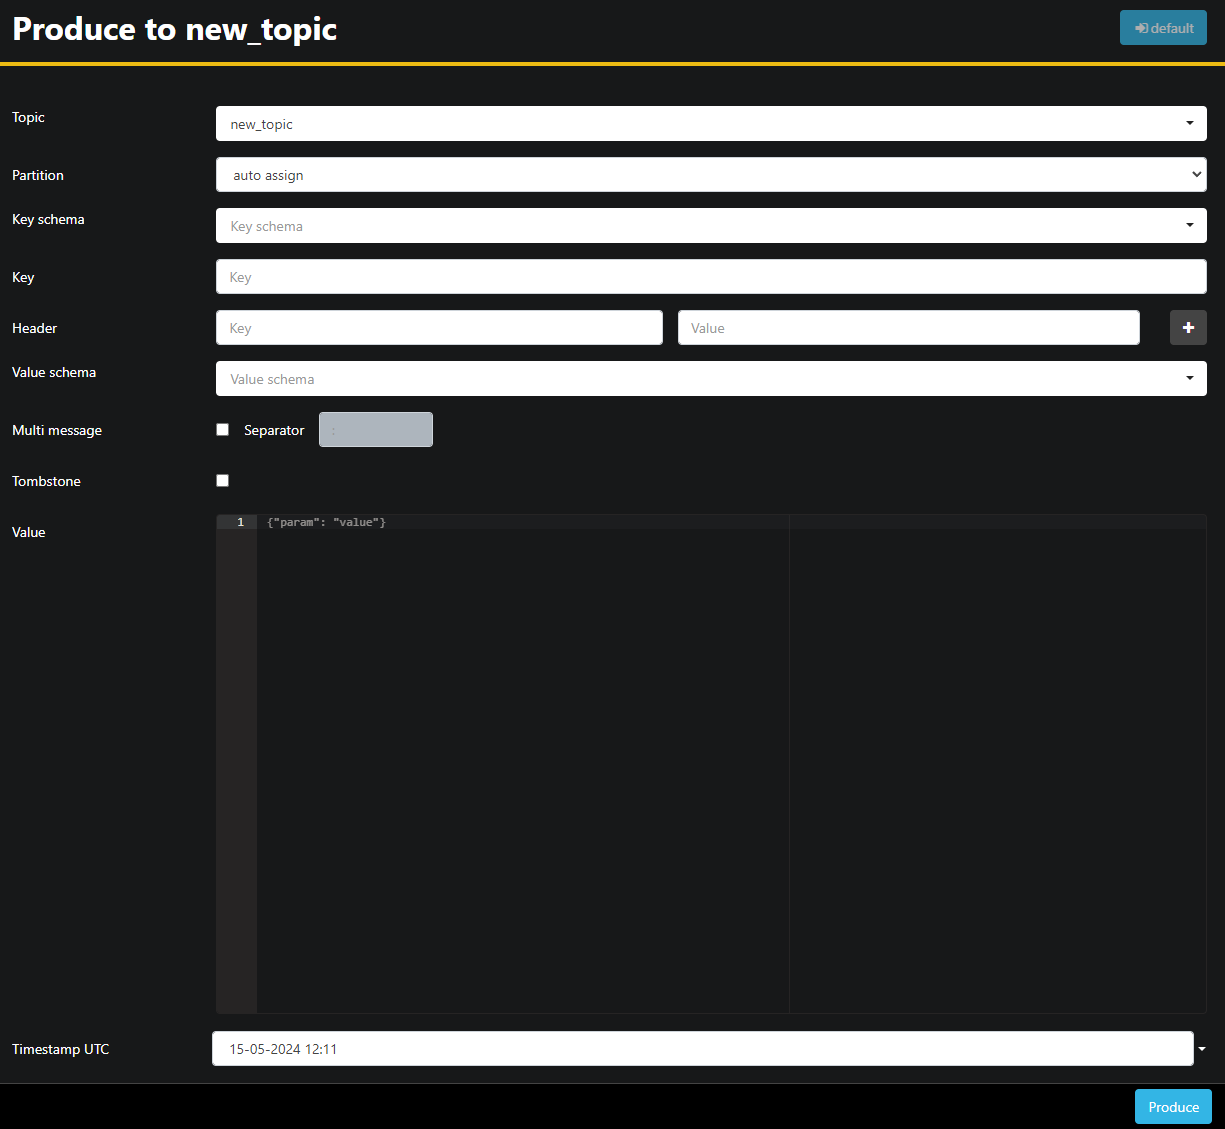
AKHQ will automatically fill in the topic name for you. In the Value field, enter Hello World!, then press Produce. The message will be sent to Kafka and you will see it in the Data tab:
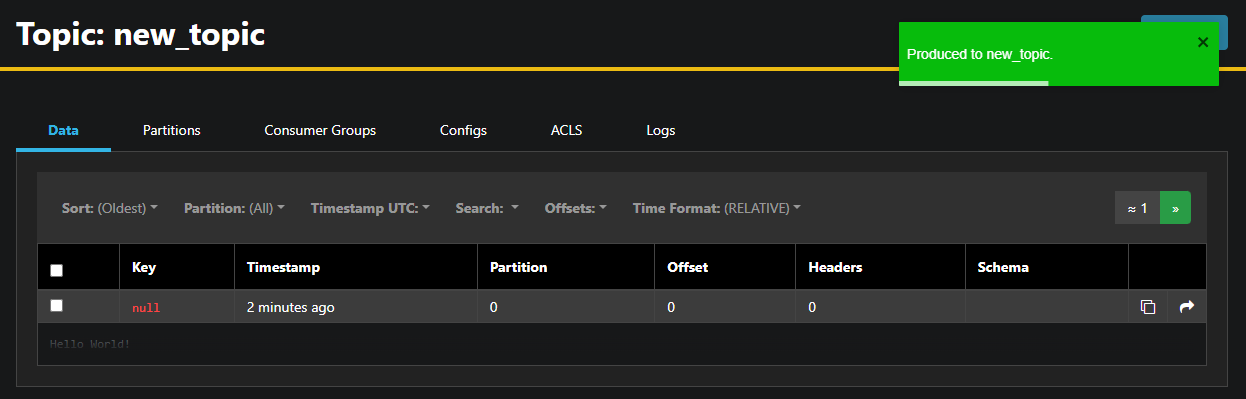
Because the content of a message can be very large, AKHQ only displays the first line. To view the full message, click on the dark area after the row to reveal it.
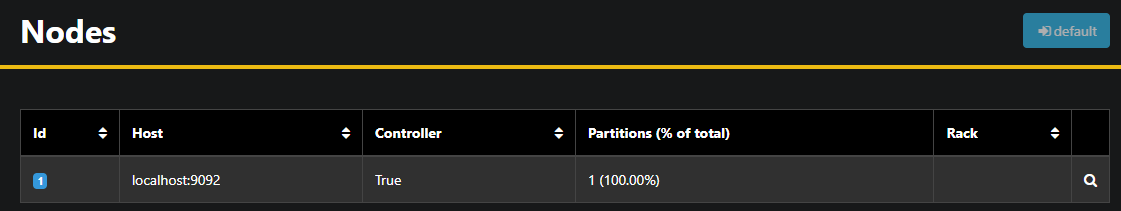
In the left sidebar, you can list the brokers in the cluster by clicking on Nodes. Currently, the cluster consists of only one node:
Double-clicking on a node opens its configuration, allowing you to change any of the settings remotely:
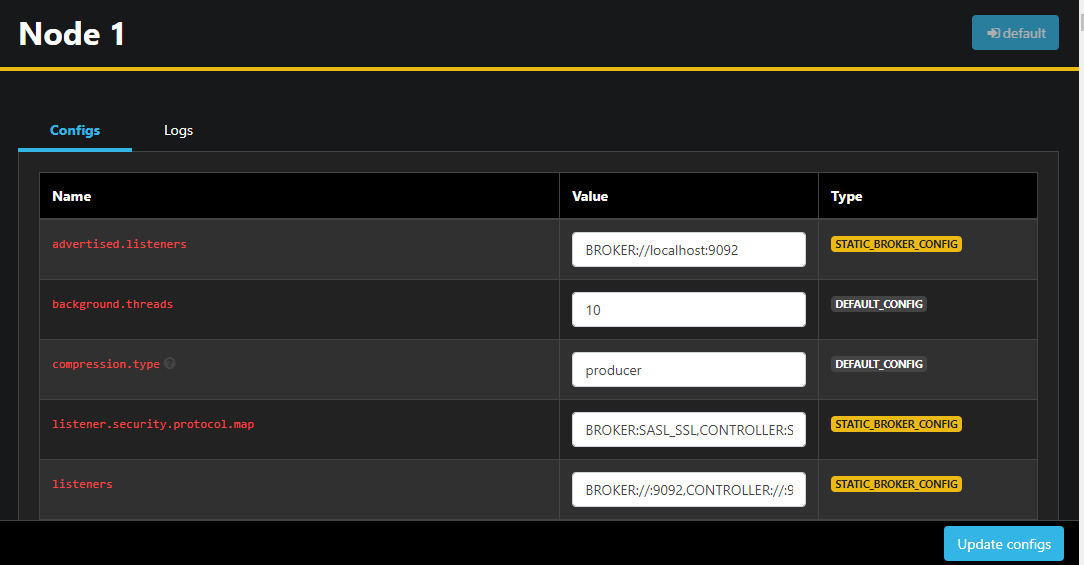
Once you have made your changes, you can apply them by pressing the Update configs button at the bottom right. Similarly, you can view and change the configuration of each of the themes by accessing them and going to the Configs tab.
In this section, you have set up AKHQ, a web application that provides an easy-to-use interface for managing and viewing Kafka nodes and topics remotely. It allows you to produce and consume messages in topics and update configuration parameters of both topics and nodes on the fly.
Result
In this tutorial, you secured your Kafka installation by configuring TLS for encryption and SASL for user authentication. You also set up metric exports using Prometheus and visualized them in Grafana. Next, you learned how to use AKHQ, a web application for managing Kafka clusters.